Linear Exercises
1 Ellenberg Chapter 1
Read the first chapter of How Not to Be Wrong for background on linear and non-linear models.
- Brainstorm a list of things (could be environmental, social, economic, or other) you think might have an association or correlation.
- For each one state if an increase in one quantity causes an increase or decrease in the other quantity.
- Try to get to a listing of 10.
2 Linear relationships
Revisit your list of 10 potentially linear relationships from the Ellenberg Chapter 1 exercise. You are welcome to remove or add topics to your list. Imagine you are planning to gather data for these to understand the kind of relationship. You don’t need to gather data or estimate the slope. For at least 3 of them specify
- What quantity is on the x-axis (the independent quantity)? What are its units and dimensions?
- What quantity is on the y-axis (the dependent quantity)? What are its units and dimensions?
- What are the units and dimensions of the slope?
- In a sentence, write a question that you could ask or answer with this relationship.
3 Linear Notes
Please read the linked notes for this section and answer the following questions.
- How can you determine the units and dimensions of a slope?
- Does the slope change in a linear graph?
4 Unit Conversion Graph
You can represent the unit conversion from miles to meters as a linear graph.
- Draw a graph of the unit conversion going from miles to meters.
- Label the x and y axes and put numbers for the reader to use.
- Show from 0–10 miles on the x-axis.
- Show how the unit conversion is the slope.
- Show how to use the graph to make an estimation.
5 Taco Estimation
You can represent the previous exercise we did on tacos at SSU.
- Draw a graph that shows tacos needed for a number of students.
- Show from 0–20,000 students on the x-axis.
- Show the units of the slope.
- Show how the formula and the graph is related.
- Show how to use the graph to make an estimation.
6 Pizza Formula
A Rafy’s large cheese pizza is 16 USD and 2 USD for each topping.
- Write a formula for the cost of a large cheese pizza
- Sketch a graph showing the price for up to 4 toppings
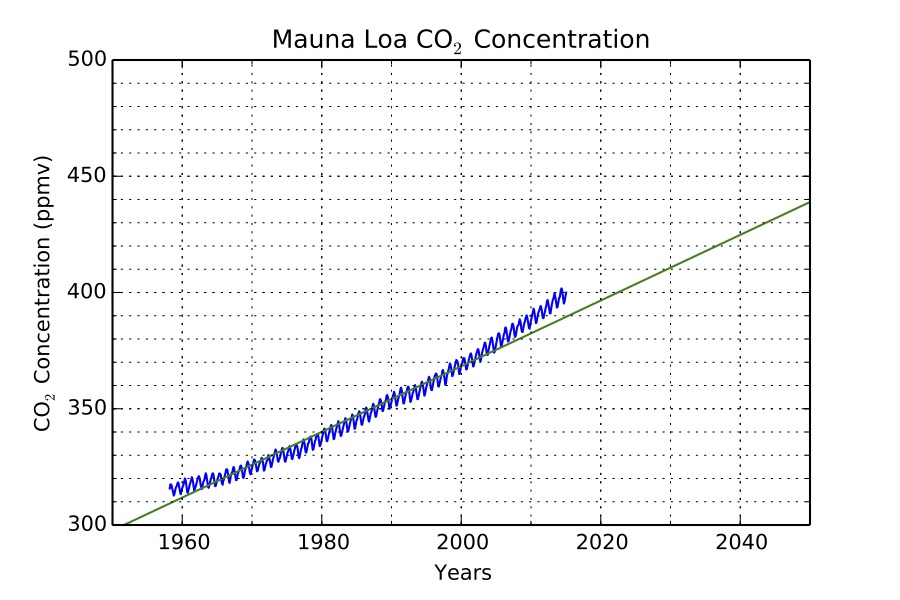
7 Modern Keeling Curve
The Keeling Curve is the carbon dioxide concentration that has been observed at the Mauna Loa Observatory since the late 1950s.
- Describe what you think is important about the slope of the Keeling Curve.
- What is the approximate slope of the carbon dioxide concentration in units of ppm per year from 2010 to 2020?
- If the carbon dioxide emissions continue at the 2010–2020 rate, what concentration do we expect in 2050?
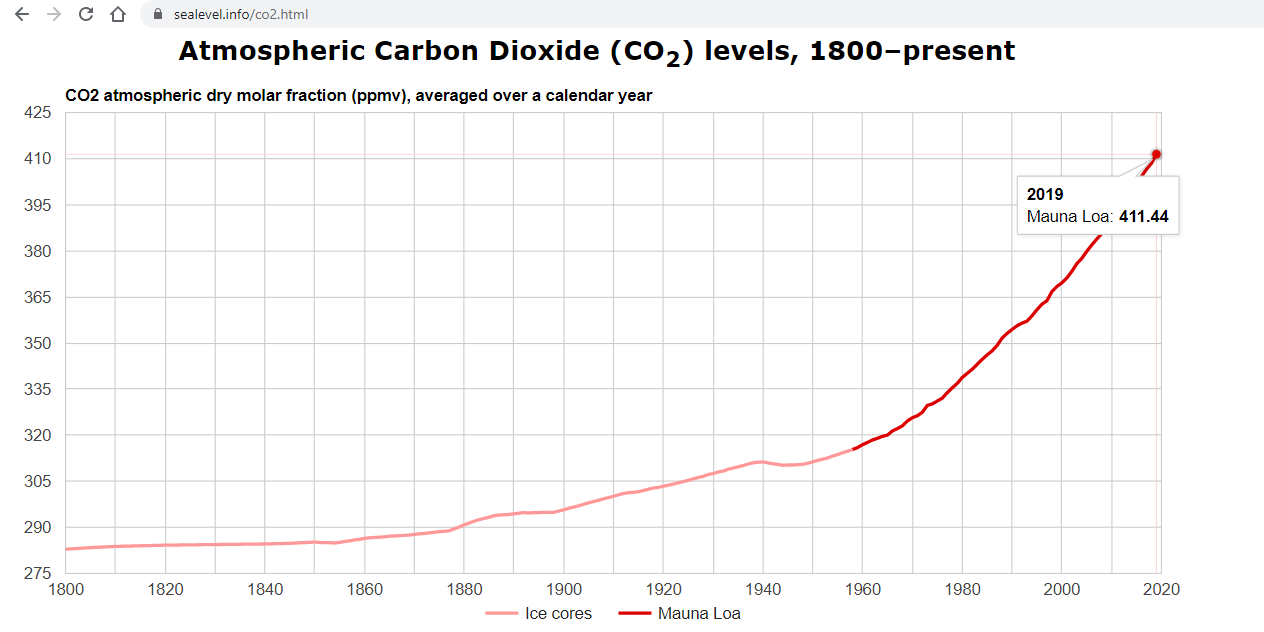
8 Early 20th Century Keeling Curve
A record of carbon dioxide concentrations from 1700 to the present is available at the Keeling Curve website.
- Describe what you think is important about the slope of the carbon dioxide concentration curve from the 1700s until now.
- What is the approximate slope of the carbon dioxide concentration in units of ppm per year from 1900 to 1950.
- If we had continued at the 1900–1950 rate, what would the concentration be now?
9 Taco Estimation Graph
Using your taco estimation, create a spreadsheet that
- Has a column for the number of people
- Has a column that calculates the number of tacos
- Creates a graph from the people and tacos column
Upload a screenshot showing the graph and your formulas.
10 Unit Conversion Scale
Create a linear scale on paper that you can use to “convert” between units. Choose your own unit conversion from this list (meters to yards, square feet to square meters, kilograms to pounds, or liters to gallons).
- Mark your scale for each unit in round numbers (multiples of 1, 2, 5, or 10 are common)
- State clearly the conversion for each unit to distance on the page
- Show clearly how you computed the conversion between the unit and the distance on the page
- Use a spreadsheet to calculate the location (distance) from zero for each of your ticks.
11 Absolute Temperature Converting Scale
Draw a linear scale showing the conversion between celsius and fahrenheit.
- Mark your scale for each unit in round numbers (multiples of 1, 2, 5, or 10 are common)
- State clearly the conversion for each unit to distance on the page
- Show clearly how you computed the conversion between the unit and the distance on the page
- Show how you are handling the difference in location of the zeros on each scale
12 Linear Relationship
Find a news article describing a topic of interest that mentions a relationship between two variables and write a short essay (~150 words) covering the following points.
- Include a link to the article and its title
- Describe the units and dimensions of these two variables
- Sketch a graph of the relationship (you make assume it is linear over a small area)
- Discuss what quantitative questions you can ask or answer using this relationship
13 Spreadsheet Extrapolation
In this exercise, you’ll plot a linear function in a spreadsheet
- Choose a slope between 2 and 5.
- Choose a y-intercept between 2 and 5.
- Use a spreadsheet to create a table of y-values corresponding to x-values between 0 and 10.
- Create a plot of your data
- Use the spreadsheet to find the slope and y-intercept of the data and show it matches your choice
- Use the spreadsheet to extrapolate and find the value of the data for the x-values of 20 and 30
- Upload a 30-60 second video of your assignment.