Linear Regression
Linear Models with Gaussian Noise
Here we combine our linear model with uncertainty. Even though data may not fall on a perfect line, we can uncover an underlying linear relationship even if the data have a lot of variation.
Before we have taken a population and broken it into two samples and looked for differences between the distributions. These concepts and techniques allow us to take a population and sort it according to a variable and see how the distribution varies.
Questions
By finding the underlying slope in the data, we can ask what is the average change in a measurement based on a change in the other measurement.
By measuring the variation in the data around that line, we can ask how much of the measurement is explained by the linear relationship and how much of the measurement can’t be explained yet.
Definitions
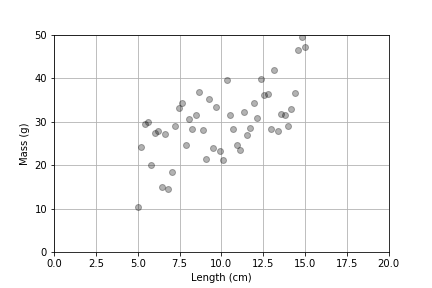
Scatter Plot
A plot to visualize data in terms of an independent and dependent variable.
Independent Variable
This is the variable that we can “control” in an experiment or study.
Dependent Variable
This is the variable that measures the outcome in our experiment or study.
Linear Regression
The mathematical technique used to determine the linear model that “best” fits a set of data. In linear regression, we have one independent variable and one dependent variable.
This fit is quantified by minimizing the areas of the squares that fit between the data and the line as represented in the following link.
Anscombe’s Quartet
Note that data can have the same regression results but be very different in shape. We must be sure that our data match our assumptions.
Multiple Linear Regression
This is a regression model that has multiple independent variables and one dependent variable.
These models help us determine the relative contribution of these multiple independent variables.