CalEnviroScreen
The CalEnviroScreen tool and data set provides examples of several of the concepts we are exploring in this course.
Here are some example questions and a tool that can provide evidence.
- How asthmatic is california?
- histogram/distribution
- mean/median/deviation
- How is my regions asthma compared to CA?
- percentile
- If I choose an area at random in CA, what is the chance it has higher asthma than my area?
- percentile
- Do any groups (age, ancestry) have worse asthma
- compare population histograms/means
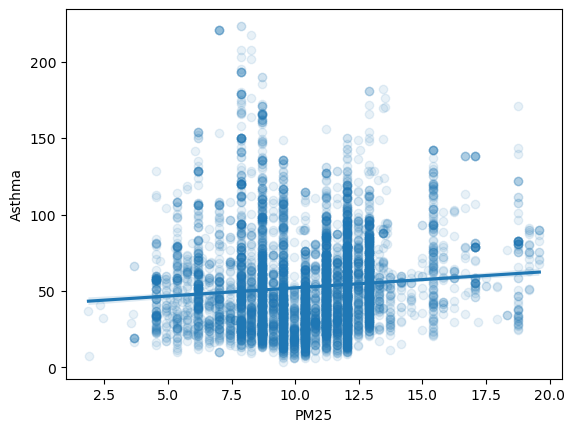
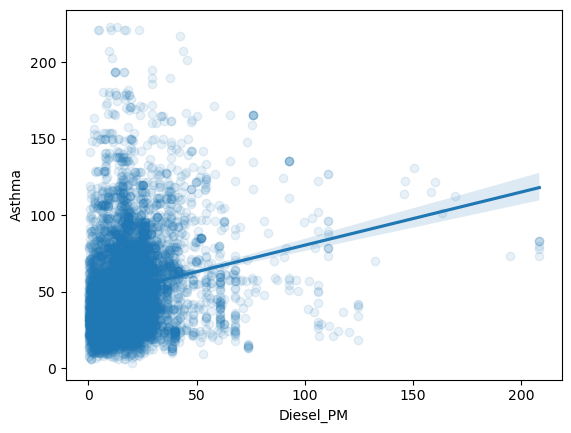
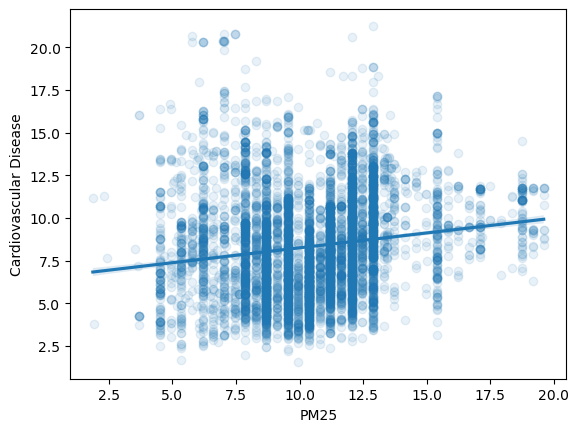
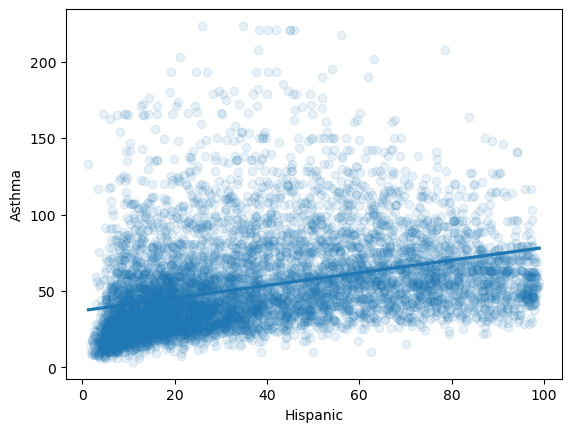
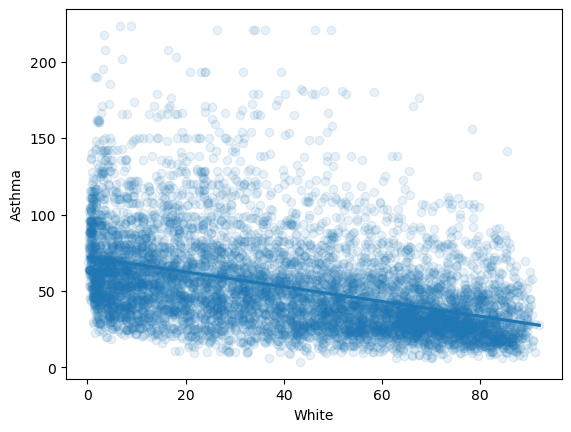
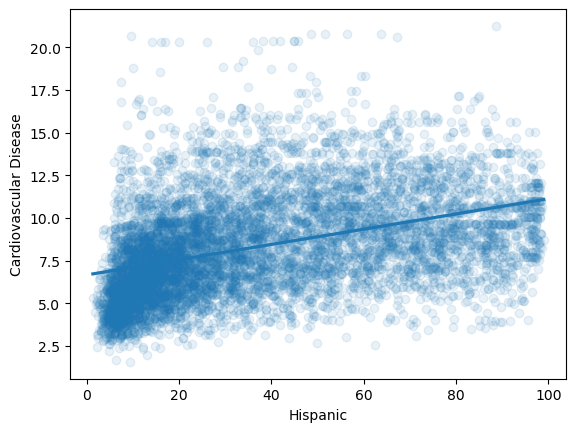
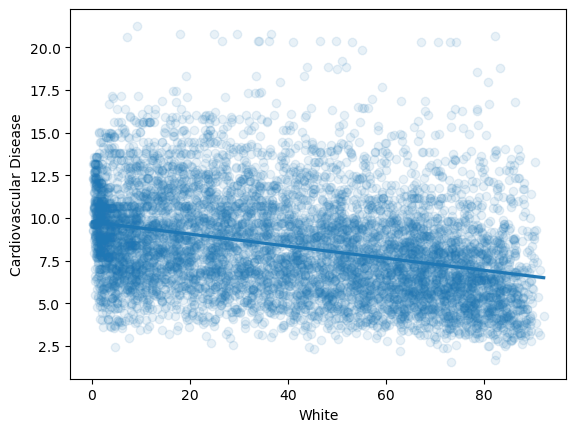
- Are there variables that correlate with asthma?
- linear regression
Associations
Keep in mind that these associations do not on their own establish causality.