Populations and Samples
Central Limit Calculation
We want to use the CalEnviroScreen data and the central limit theorem to see how likely it is that a factor influences an outcome in the data.
We can look at the case of asthma and pollution. We can take a sample of census tracts with high pollution and compare the means of those asthma measurements to the overall mean. We then use the central limit theorem to see how likely we were to see that mean at random.
Spreadsheet Implementation
When we have a large data set like the CalEnviroScreen data, we want to use a spreadsheet to compute the data.
We start with the strategy and then move on to the spreadsheet implementation.
Steps
- Identify measurement column (the population)
- Compute mean and standard deviation of measurement column
- Identify criteria for your subpopulation
- Select this subpopulation using spreadsheet commands
- Determine how many census tracts are in the subpopulation
- Use the number of census tracts to find the standard error
- Compute the mean of the subpopulation
- Compute the effect size from the subpopulation and overall population means
- Compare the effect size to the standard error to determine the likelihood
Common functions
- Mean or average
=average(range) - Gives the percentage of values below
valuein the range of data=percentrank(range, value) - Gives the value at which
percentileof the data is below that value=percentile(range, percentile) - Median
median(range) - Standard Deviation
stdev(range) - Range of data
A1:A10 - Range of data (entire column)
A:A - Range of data from another sheet
SheetName!A:A ={data!A:A}gets an entire column from other sheet/tab from a command in one cell- take average of entire population:
average(data!W:W)for column W - take
stdev(data!W:W)of entire pop for column W
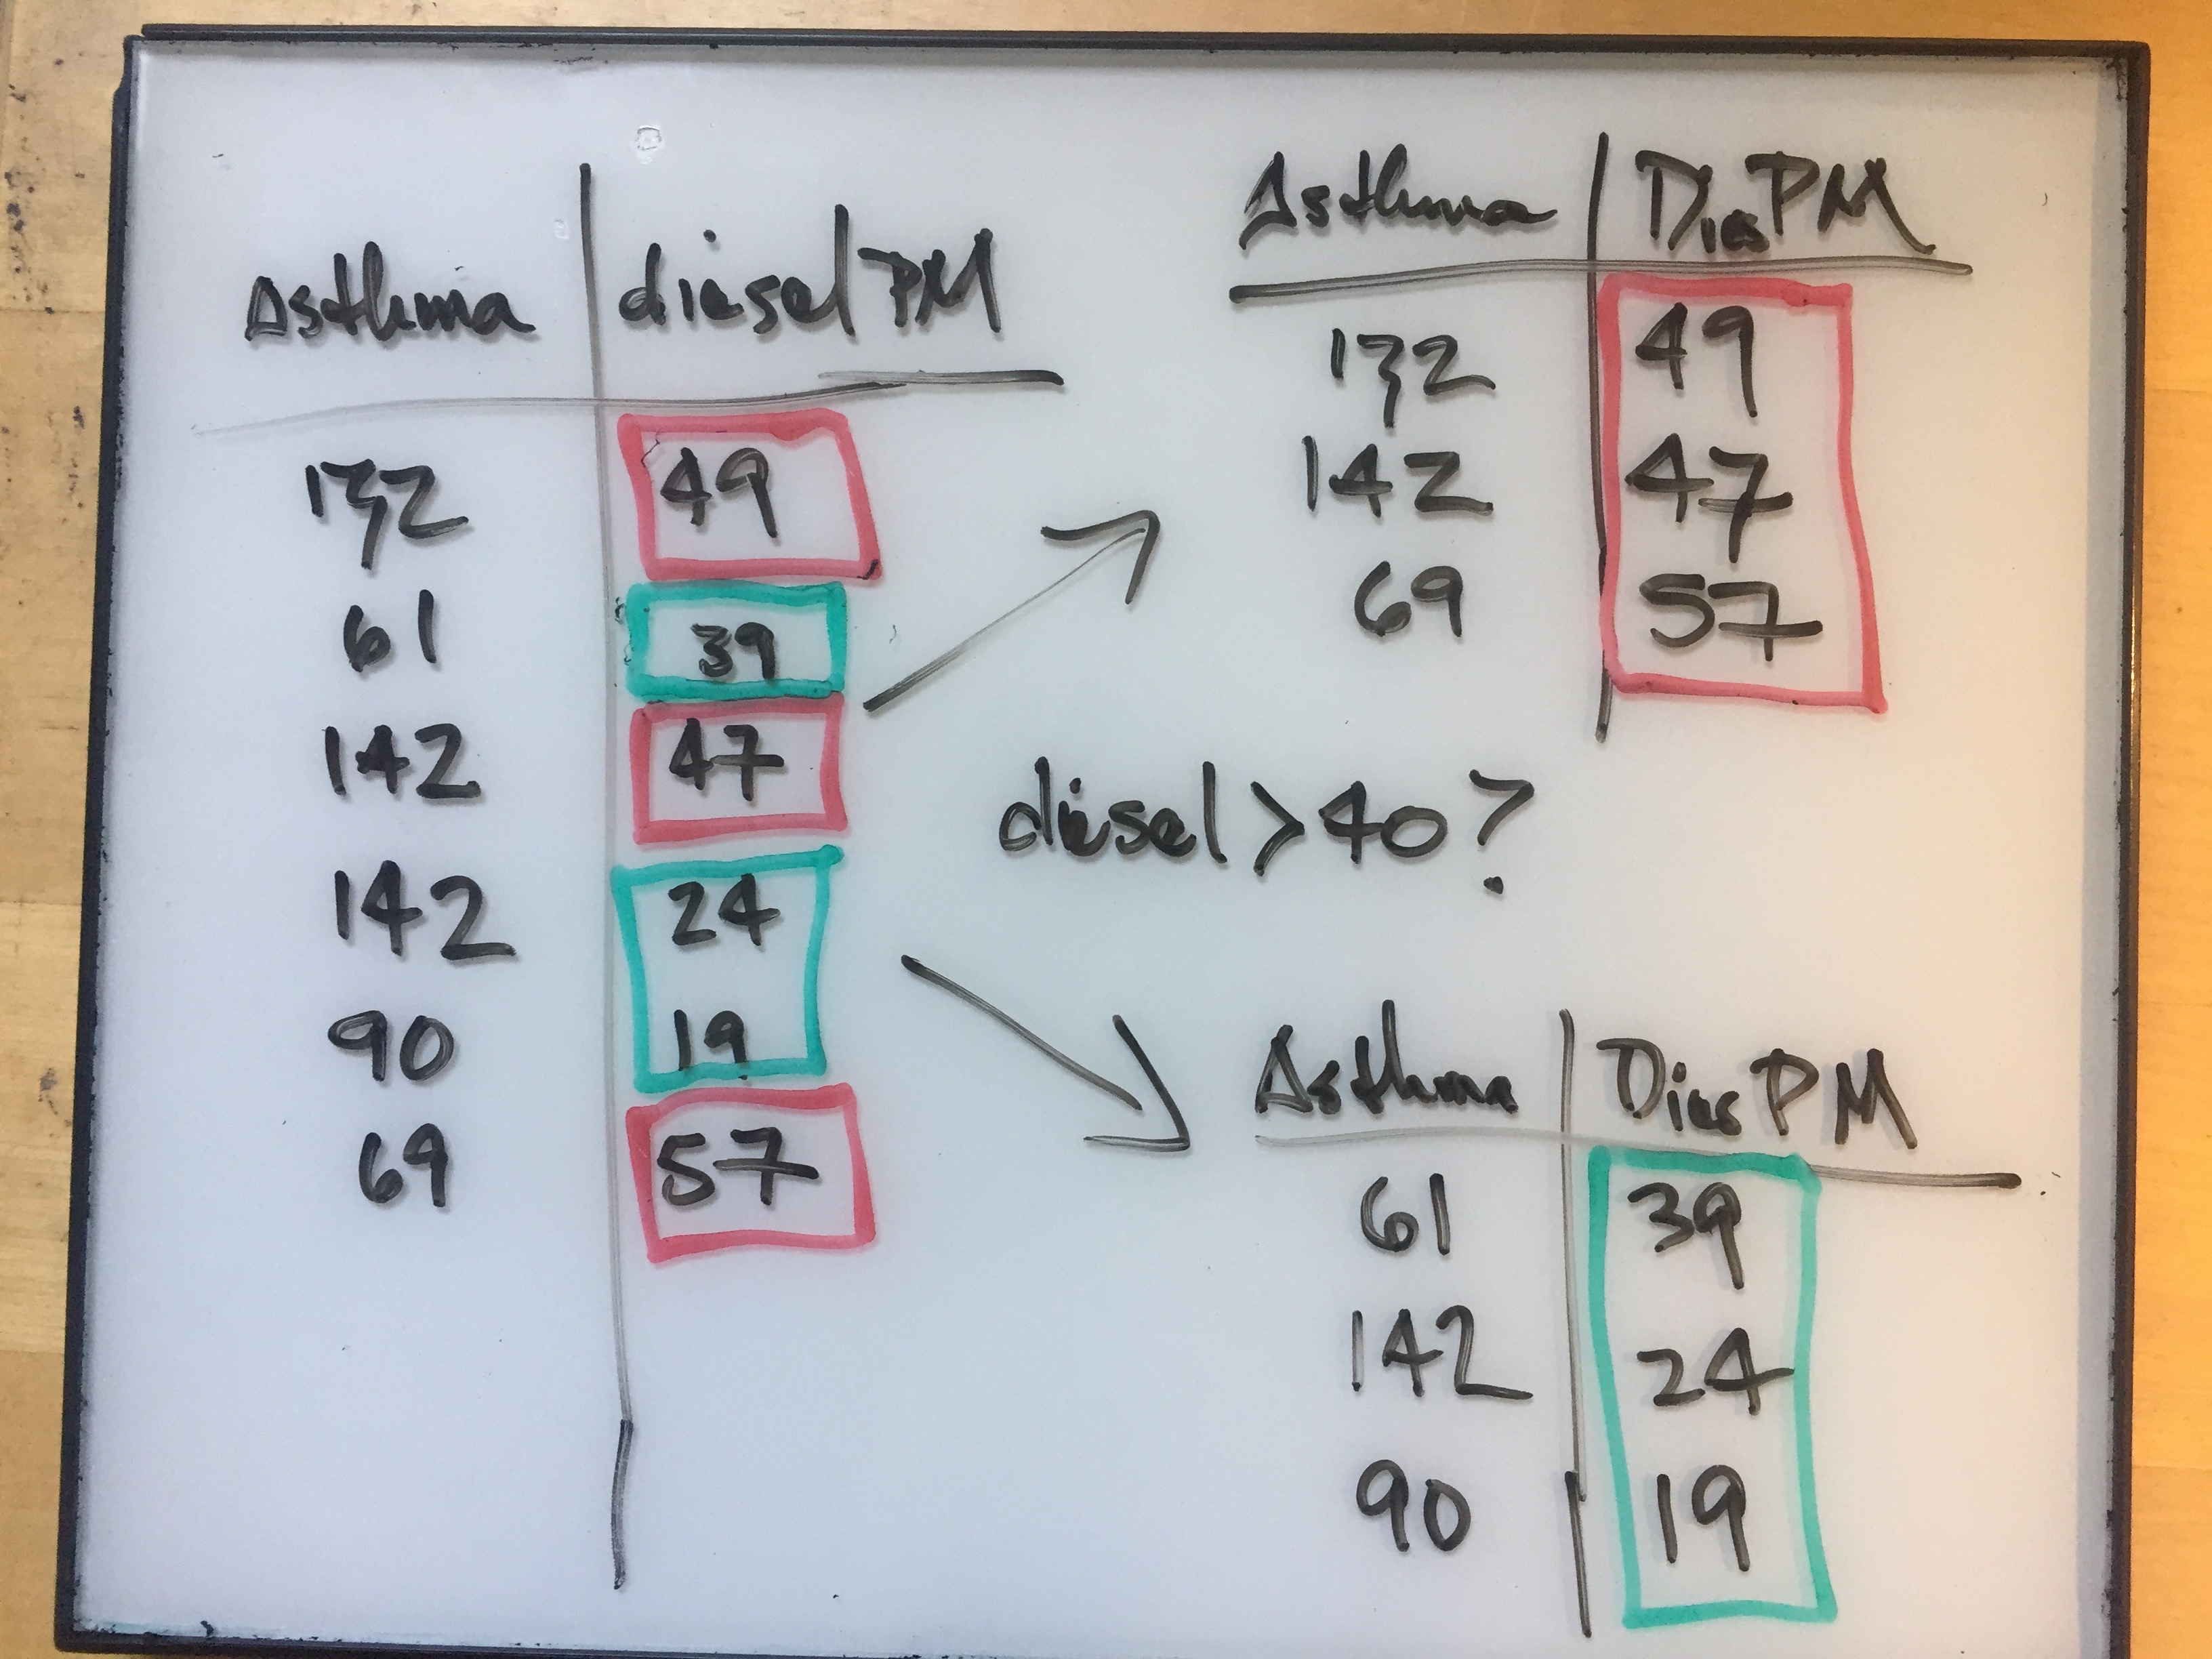
Selecting the subsample
Here you need to select certain data for computation based on the value of some other piece of associated data.
There are several ways to do this:
- you could sort your data (on say, pollution) and then find the range of asthma data corresponding to your area of interest
- you can instruct the computer to select data under a certain condition
Google Sheets Query Language
We can select a subpopulation from a column of spreadsheet data in Google Sheets using the query language. Here we tell the computer to give us data from column A according to the value of column B.
=query(data!A:BT, "select A where B < 10")
=queryis the commanddata!tells the computer to look at the data sheet- if your sheet name has spaces in it, you’ll need to put the sheet name in single quotes (’’)
A:BTsays use columns A through BTselect Asays take values from column Awhere B < 10says to take those values from where column B is less than 10
Advanced Spreadsheet Technique
You can place a column value in a cell and use it to construct the formulas above.
- If you want to use a cell as part of a range we use
=INDIRECT() - If you want to create a string based on cells we use
=CONCATENATE() - There is also a shortcut format:
"&D1$"to use a cell in the query
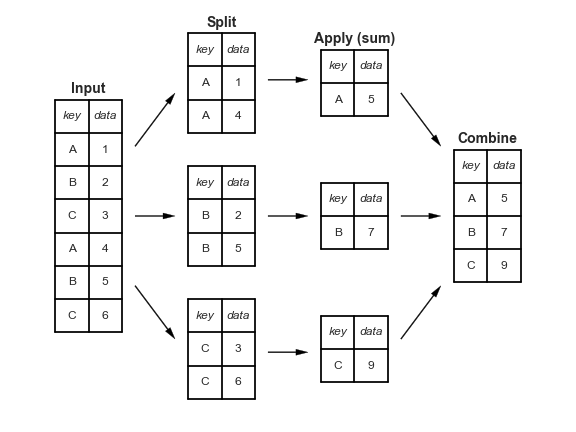
Split Apply Combine
What we are doing is related to a useful computation technique called Split-Apply-Combine.
We split the data into parts, apply a mathematical function to each part, and combine the results.
In our example we are splitting out the sample, applying the mean and counting the sample, and using it to determine the probability of observing our result.