Linear Scales
When we are reading most graphs and maps, there is a linear, proportional relationship between the distance on the page or screen and the data.
- On a map, there is a bar showing the scale length of a mile and a kilometer.
- On a graph, there is a relationship between the length on the page and the data.
Proportional Relationship
- If b=0 we say x and y are proportional
- Symbol \propto
- Has a linear relationship
- The independent variable is zero when the dependent variable is zero
- If two things are proportional, the values of the two properties are related by a constant factor
- Most of our unit conversions are proportional relationships
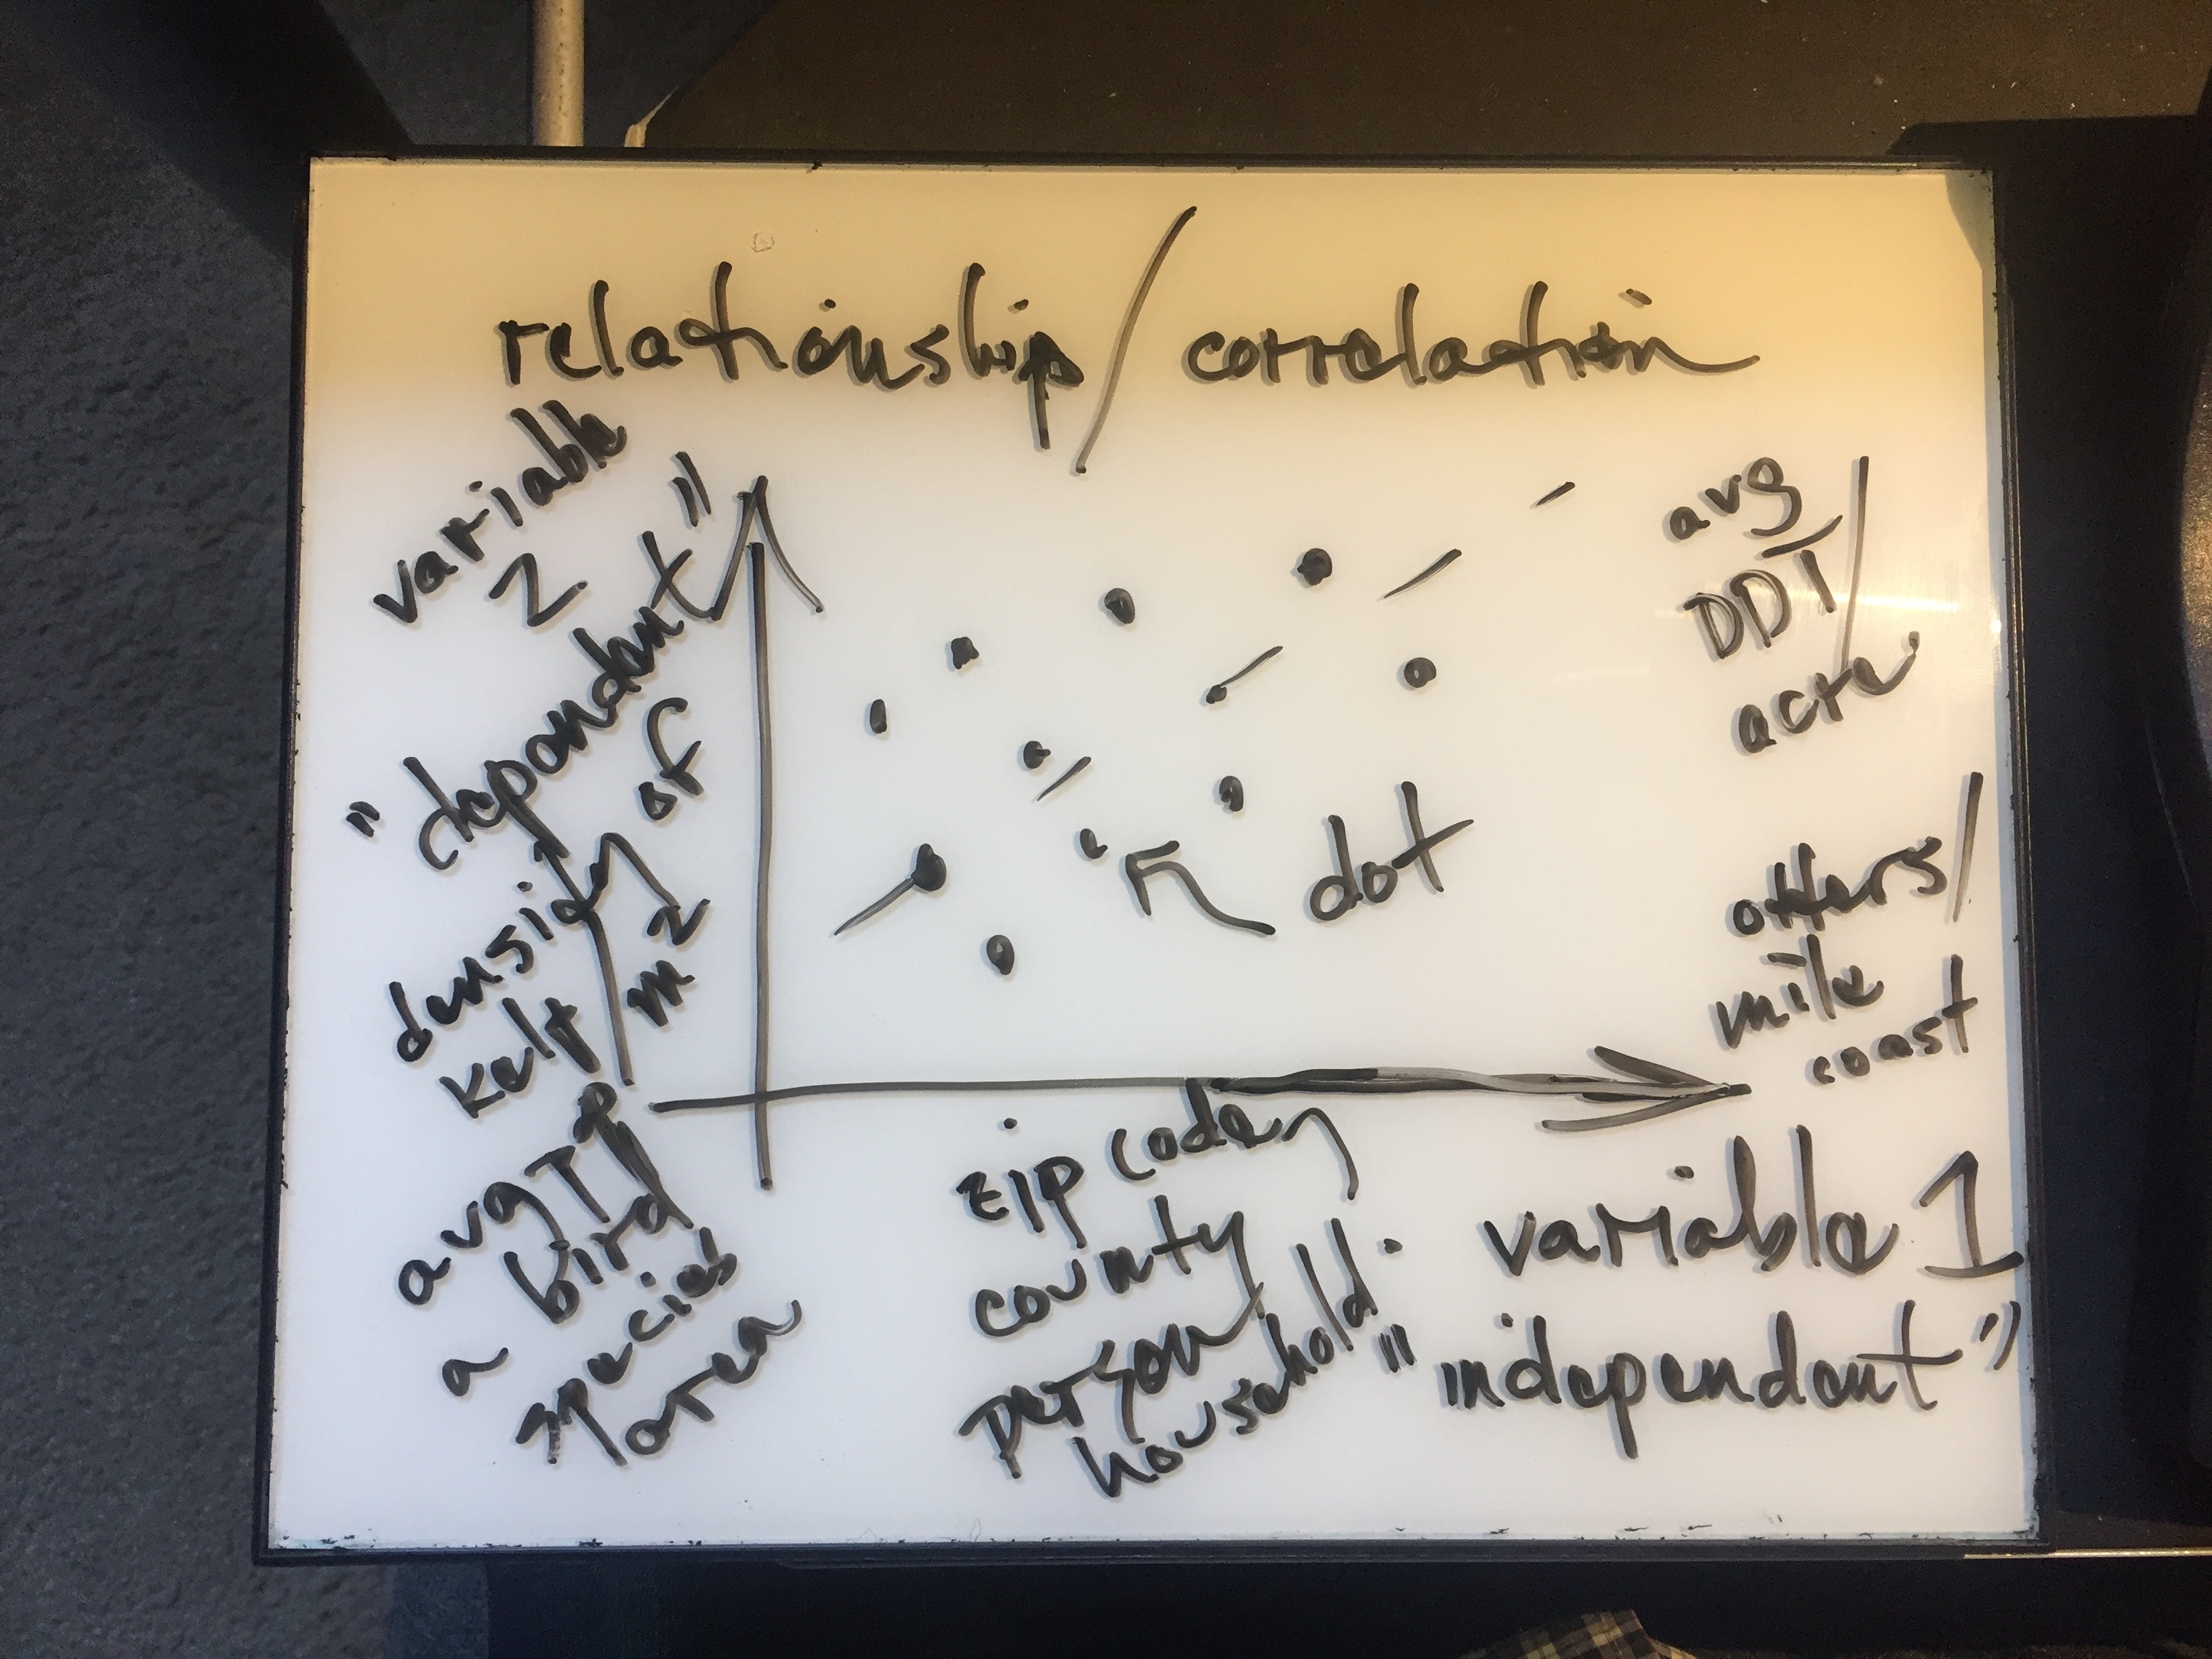
Drawing a Graph
When you draw a graph, think about what you are communicating to your audience.
- What is the story you are trying to tell?
- What is the range of data on the x and y axes?
- Where should you place ticks and tick labels
- Draw out axes, ticks, labels
- Draw the data points on the graph
- Decide if shapes, color, and size would help you
- Draw the trendline
- Draw any annotations
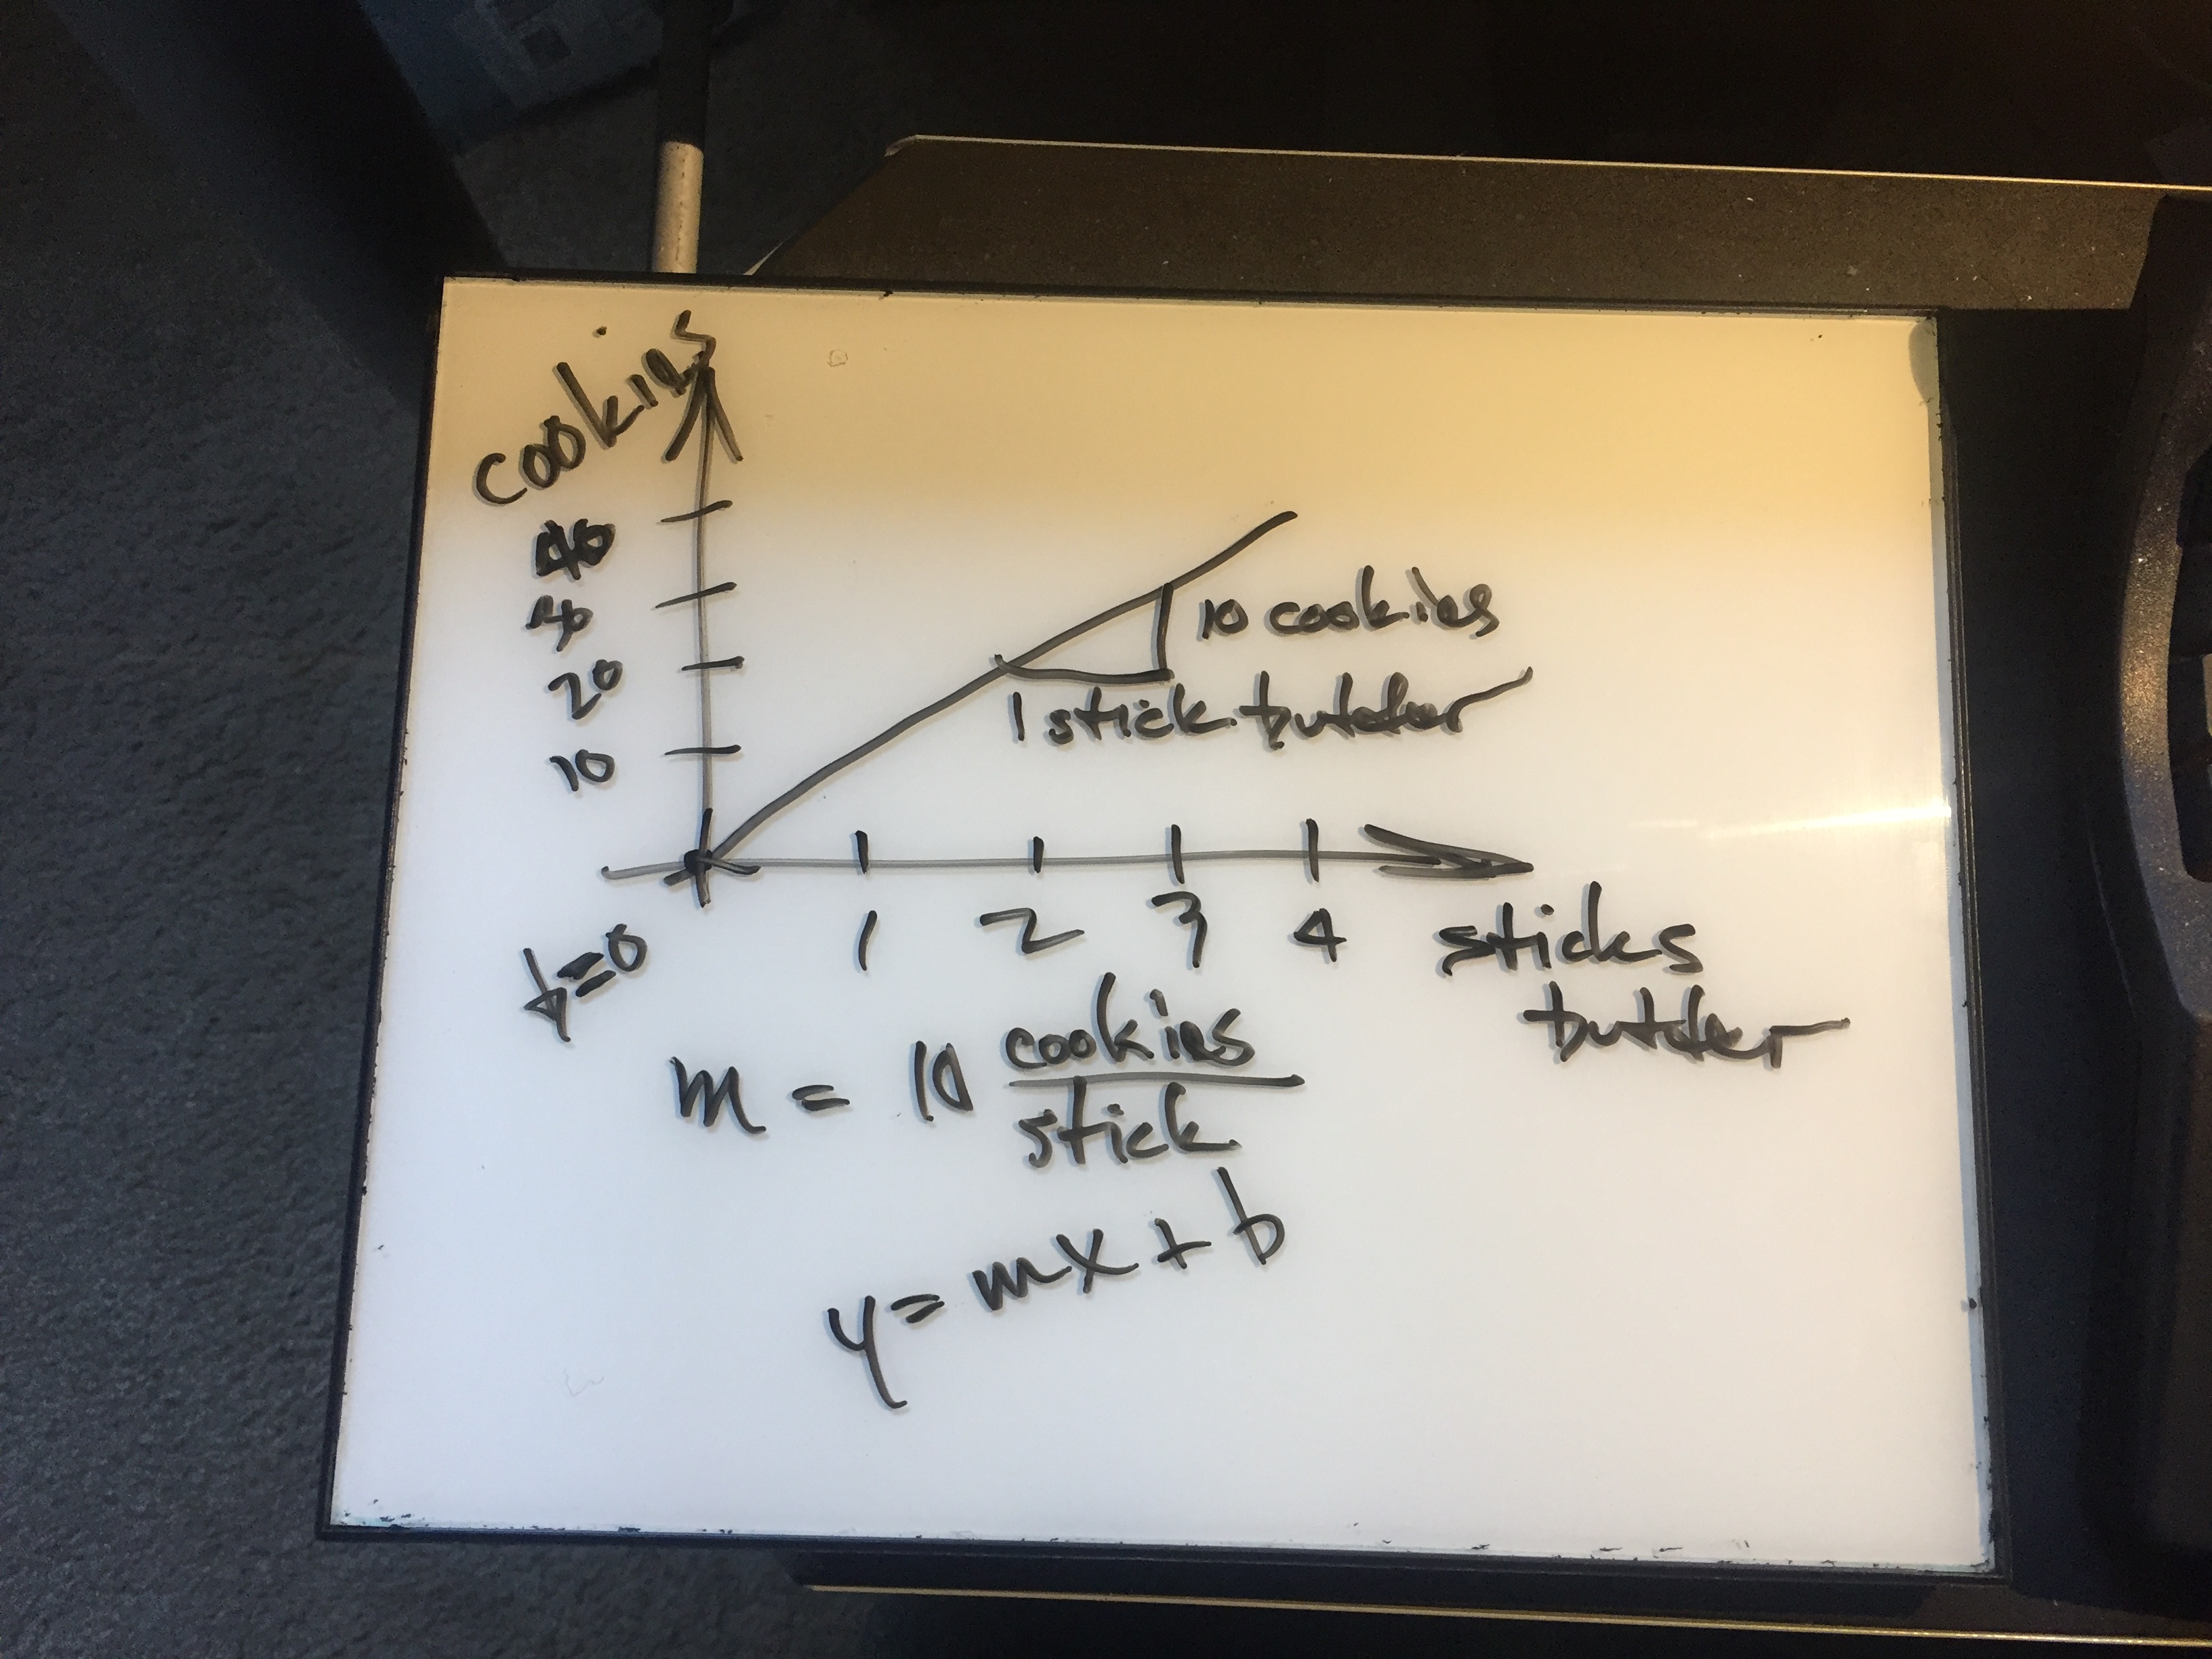
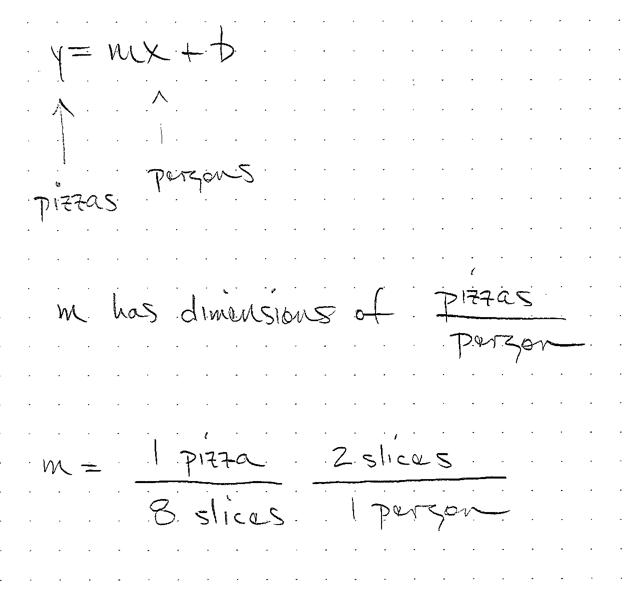
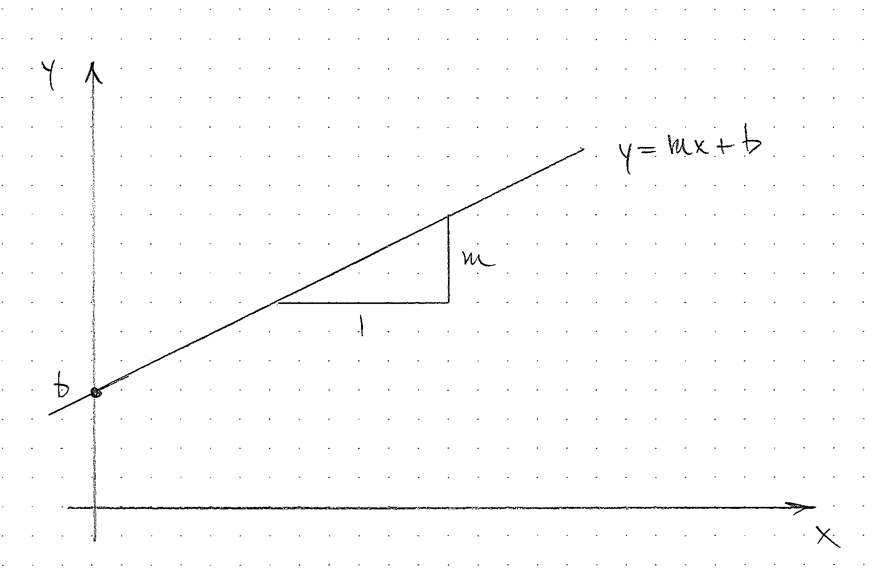
Linear equation
y = mx + b
Estimations
Estimations
Linear equation
Linear equations
- If b \neq 0 it is a linear function.
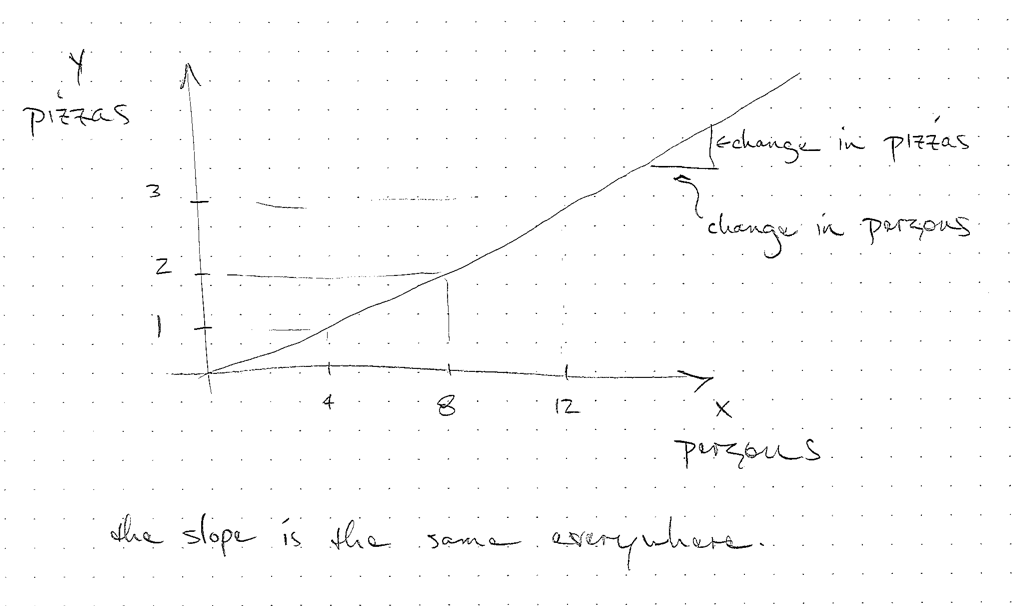
- For both, a change in x has a
change in y no matter the value of
Estimations
- The estimations we have used so far have assumed linear models
- We often have a quantity x and we have to figure out m to get y.
Linear Fits
- If we have a bunch of data that is roughly linear, we can extract a model
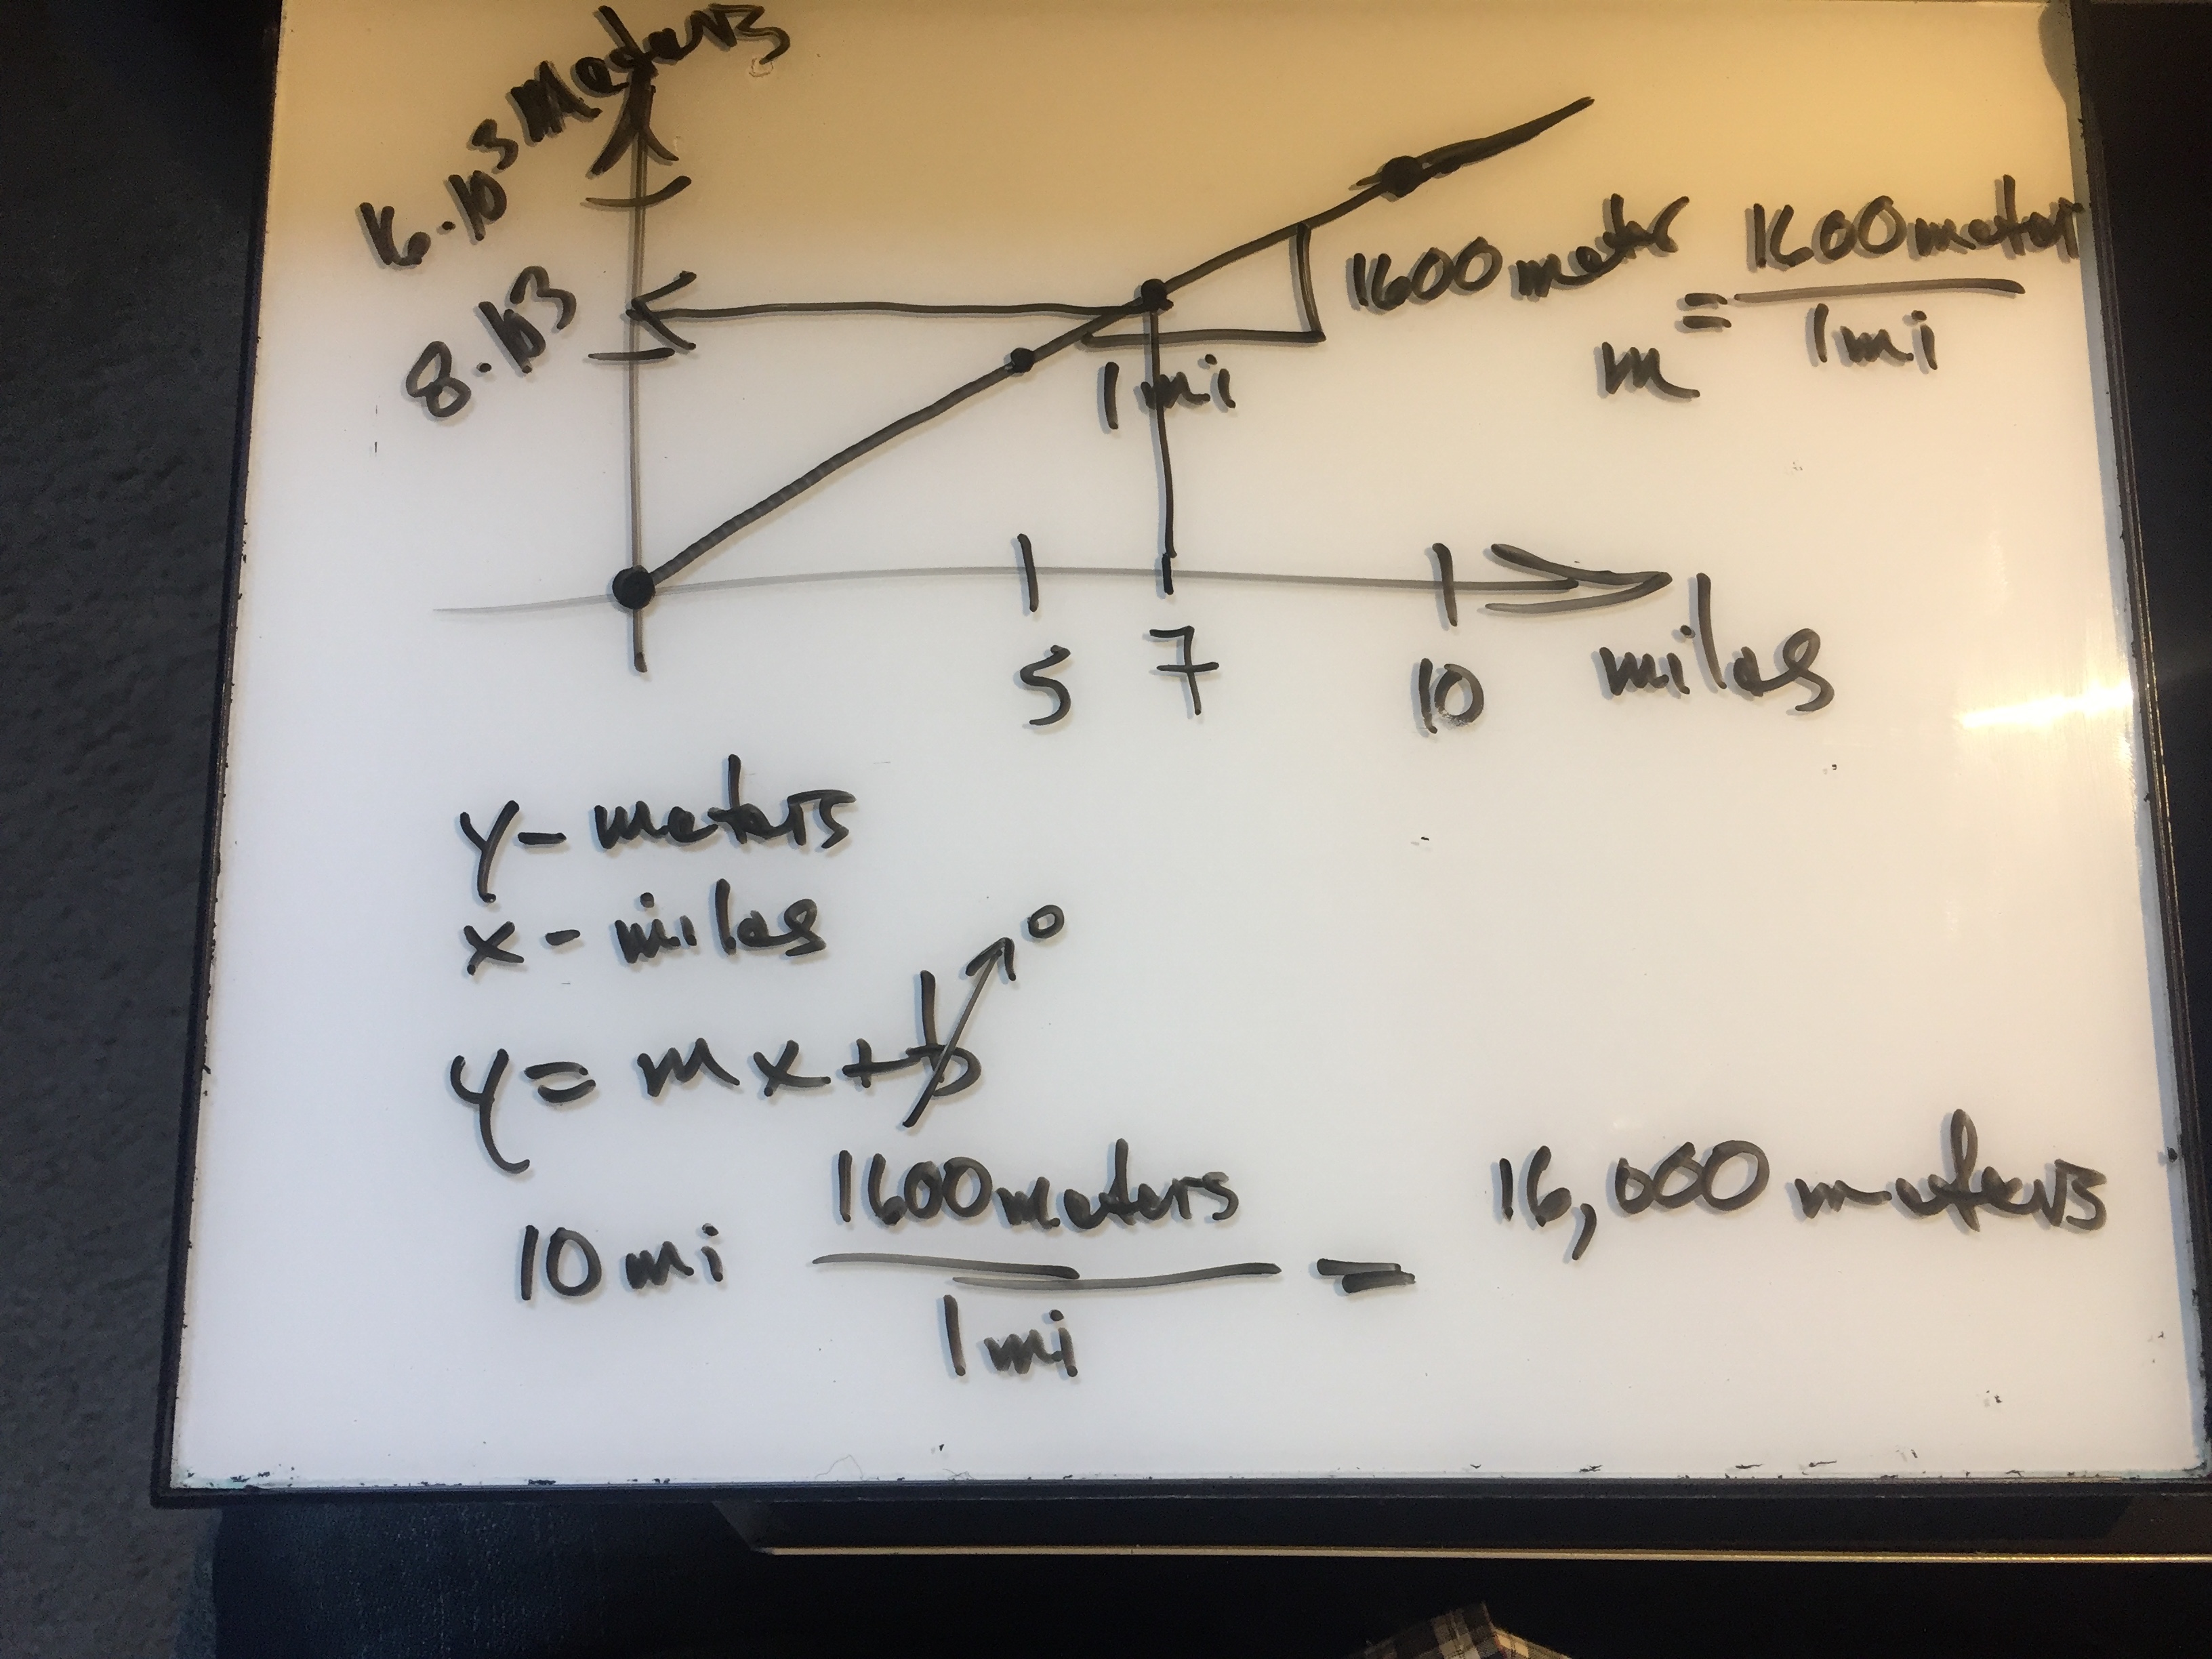
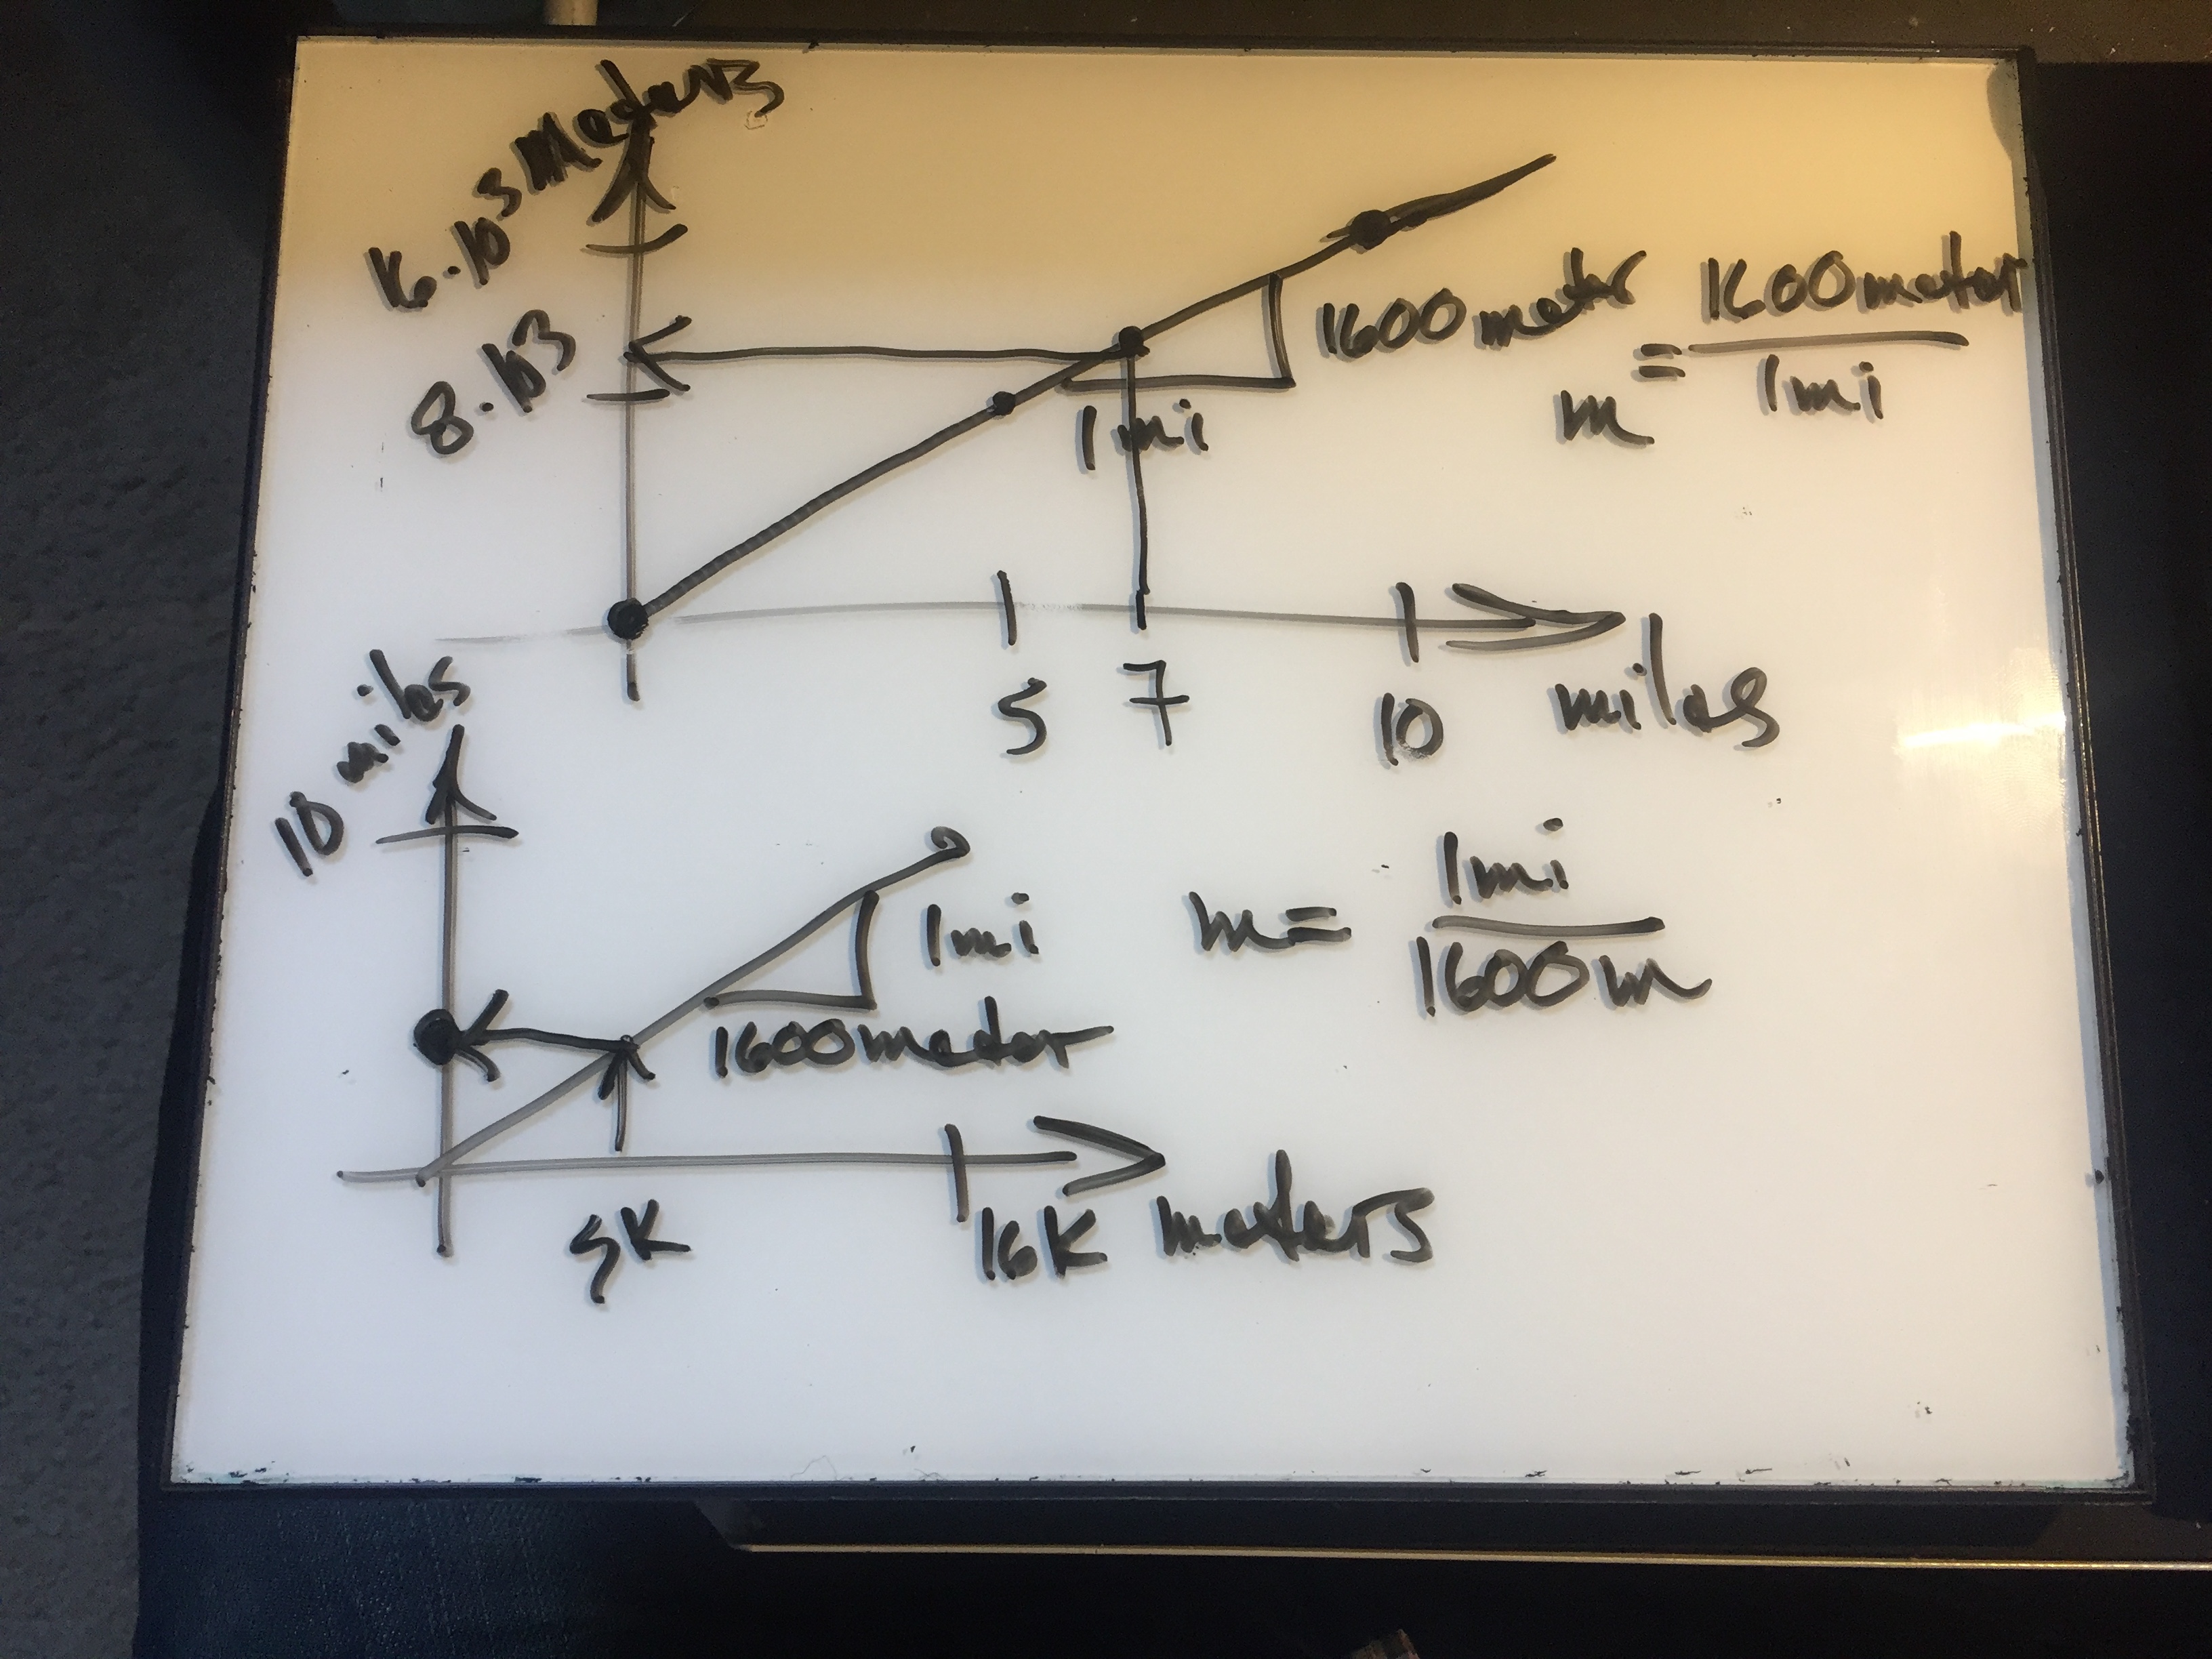
Unit Conversions
- In a unit conversion we can plot the starting units on the x-axis as the dependent variable.
- We can plot the ending units on the y-axis as the independent variable.
- The “unit conversion” is the slope of this line.
Details
Intercepts
- What types of models are likely to have an intercept?
- What models will have an intercept of zero?
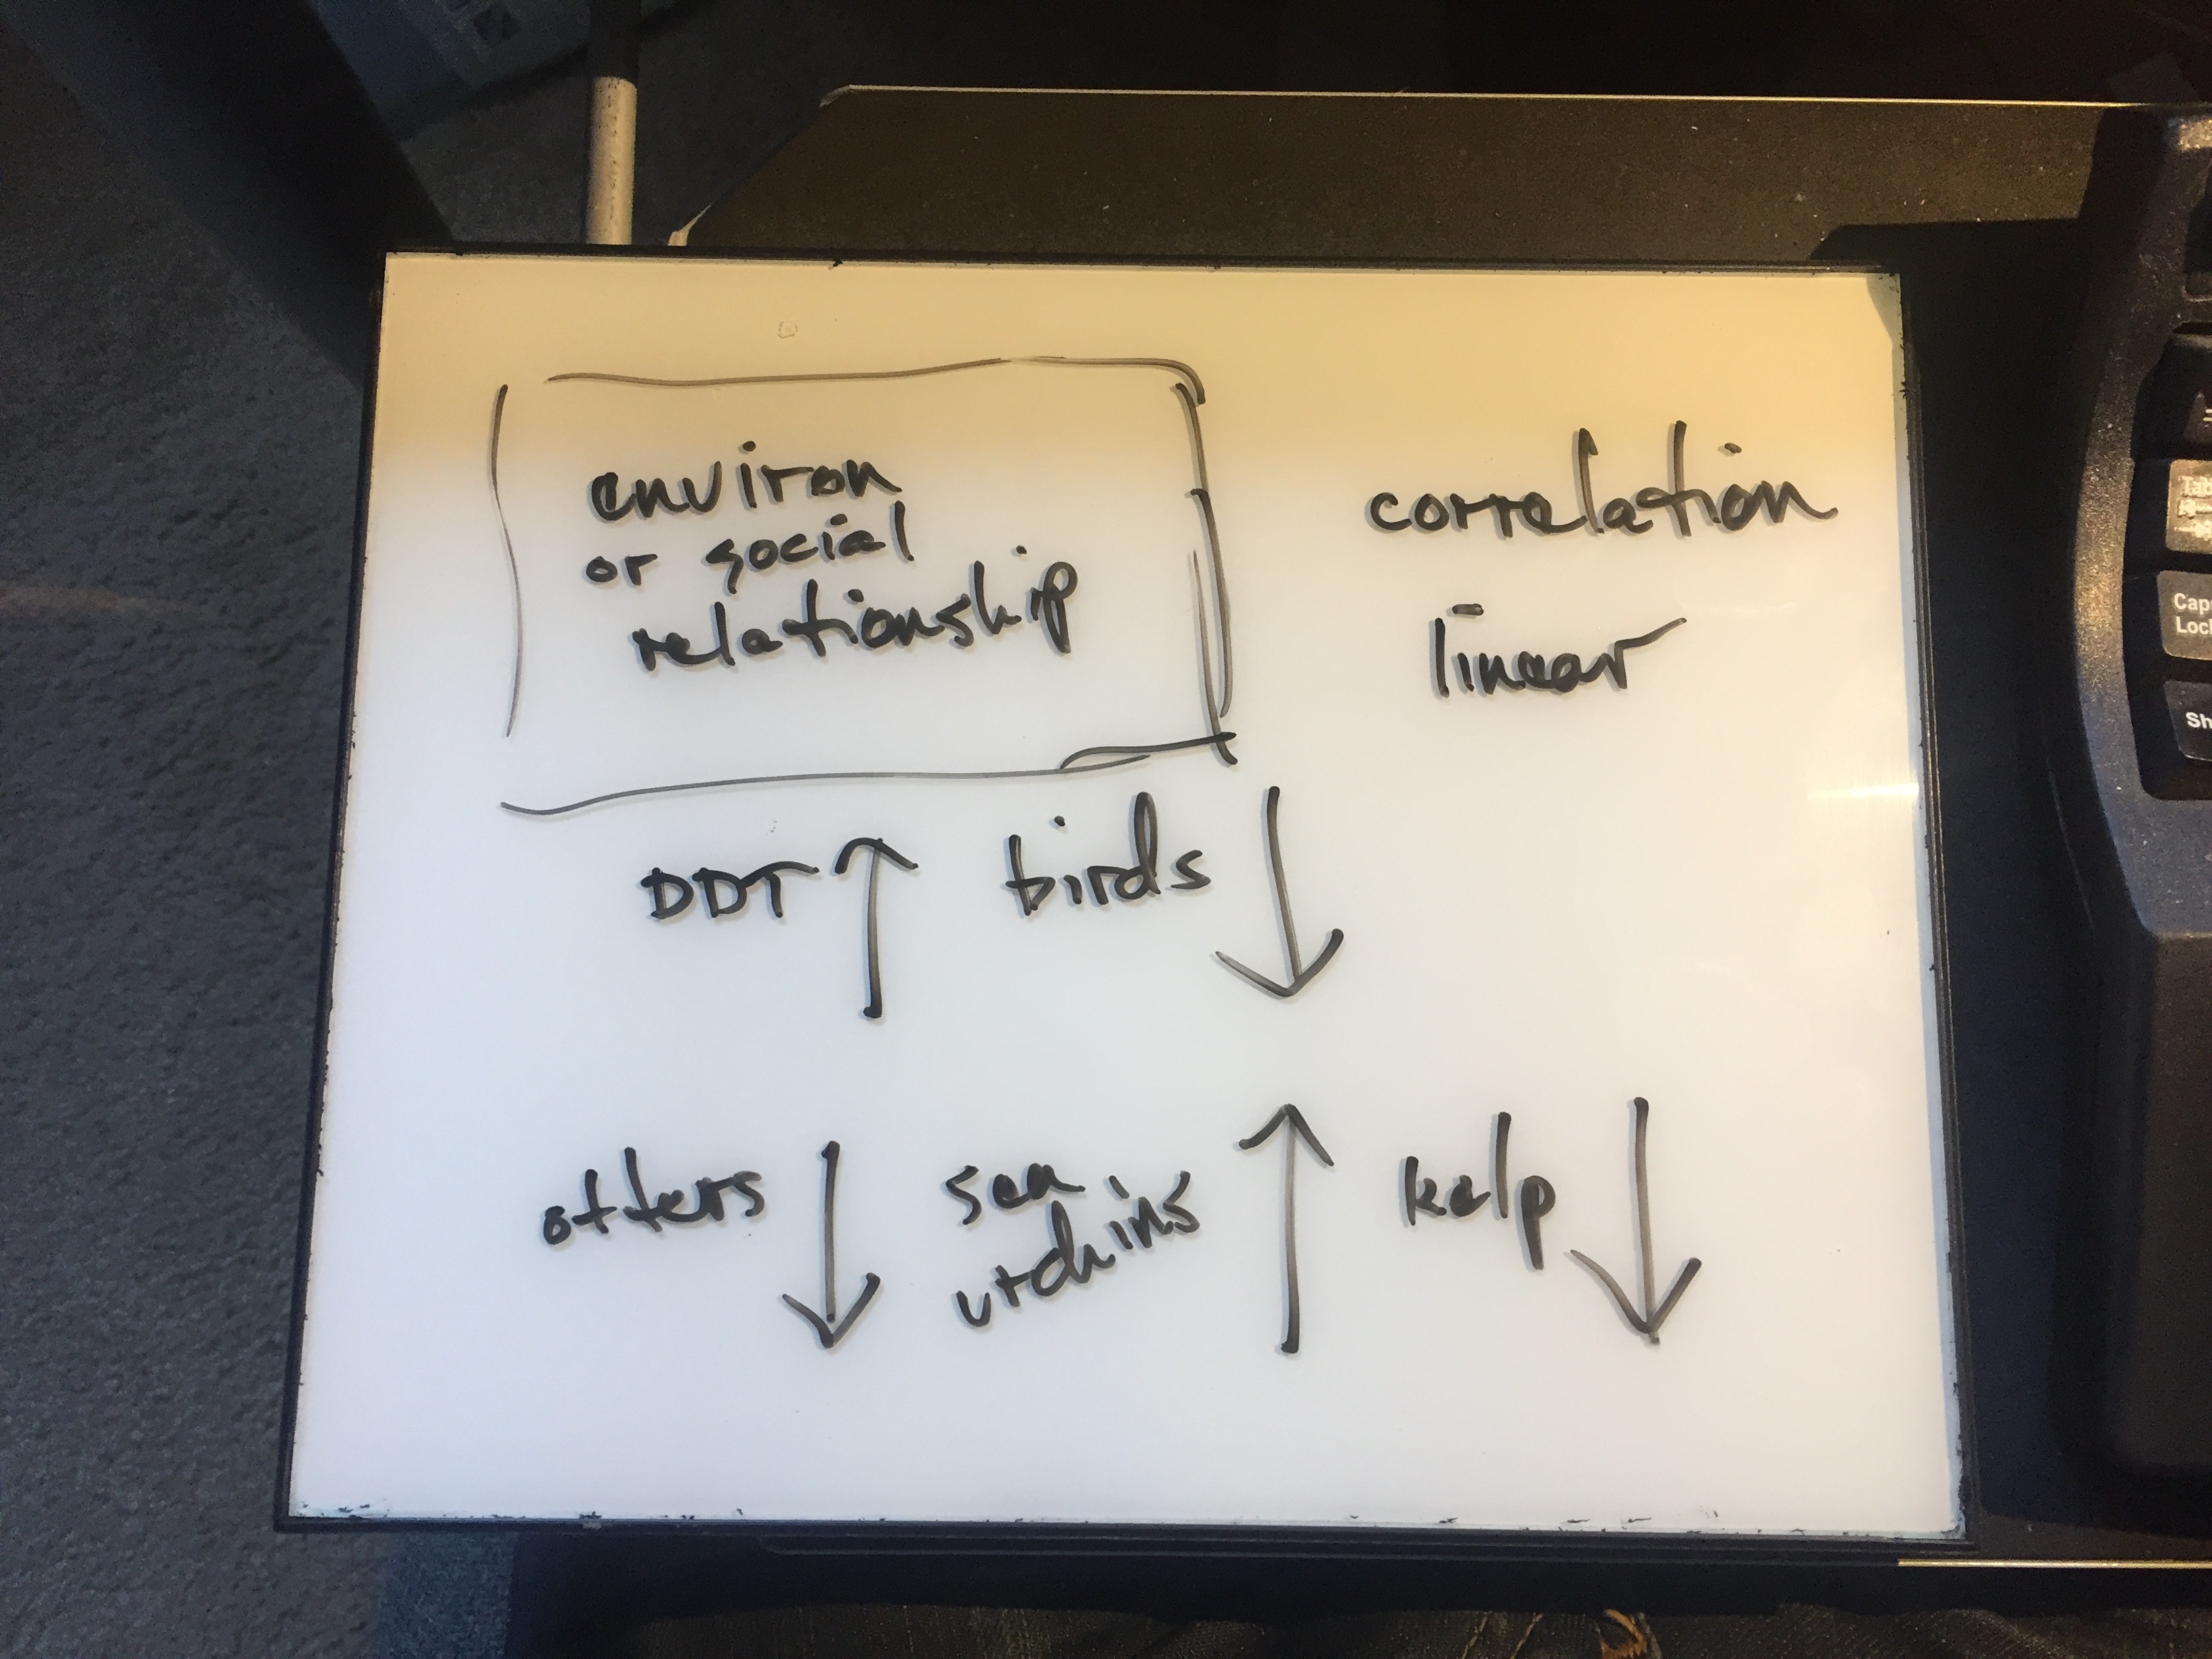
Linear Models
Name some models or phenomenon that exhibit a linear relationship.
- Taxi cab ride
- Pizza price with toppings
- Electricity bill
Circle questions
- Is the circumference of a circle is proportional to its radius?
- Is the constant of proportionality the same for all circles?
- Is the area of a circle proportional to its radius?
Lecture Notes