Shifting Distributions
In work our work on human-environment interactions, we often want to see if we can make a change in some ensemble measurement or if some factor causes a difference in the ensemble measurements. We may represent that ensemble measurement as a distribution or histogram.
To determine if some intervention or factor has an effect, we compare the ensemble measurement of the population that did not get the intervention to the sample of the population that did.
In this section there are two main concepts to understand:
- The Central Limit Theorem
- tells us about the relationship between the distribution of a population’s measurement and the distribution of the means of samples from the population
- Null Hypothesis Significance Testing (NHST)
- for our purposes, NHST uses the central limit theorem to tell us how likely a result is given the null hypothesis
Statistical Significance
By looking at the differences between these measurements, we can determine the probability that the difference was caused by the intervention or the factor that we are investigating.
We need to recognize that due to random variations differences between otherwise identical populations can occur. We need statistical tests to measure the likelihood that these tests could have occurred at random.
The t-test and p-value are among several techniques we use.
The term statistical significance is used when this difference meets a statistical threshold we agree is meaningful.
Fairness
To look for fairness, we often split the members of a population into groups according to some categorical variable and look for differences between these two groups. If those differences are statistically significant, it provides evidence of some sort of disparate effect.
Categorical (nominal) variables include
- participation in a program
- race
- high income/low income
- different climate regions
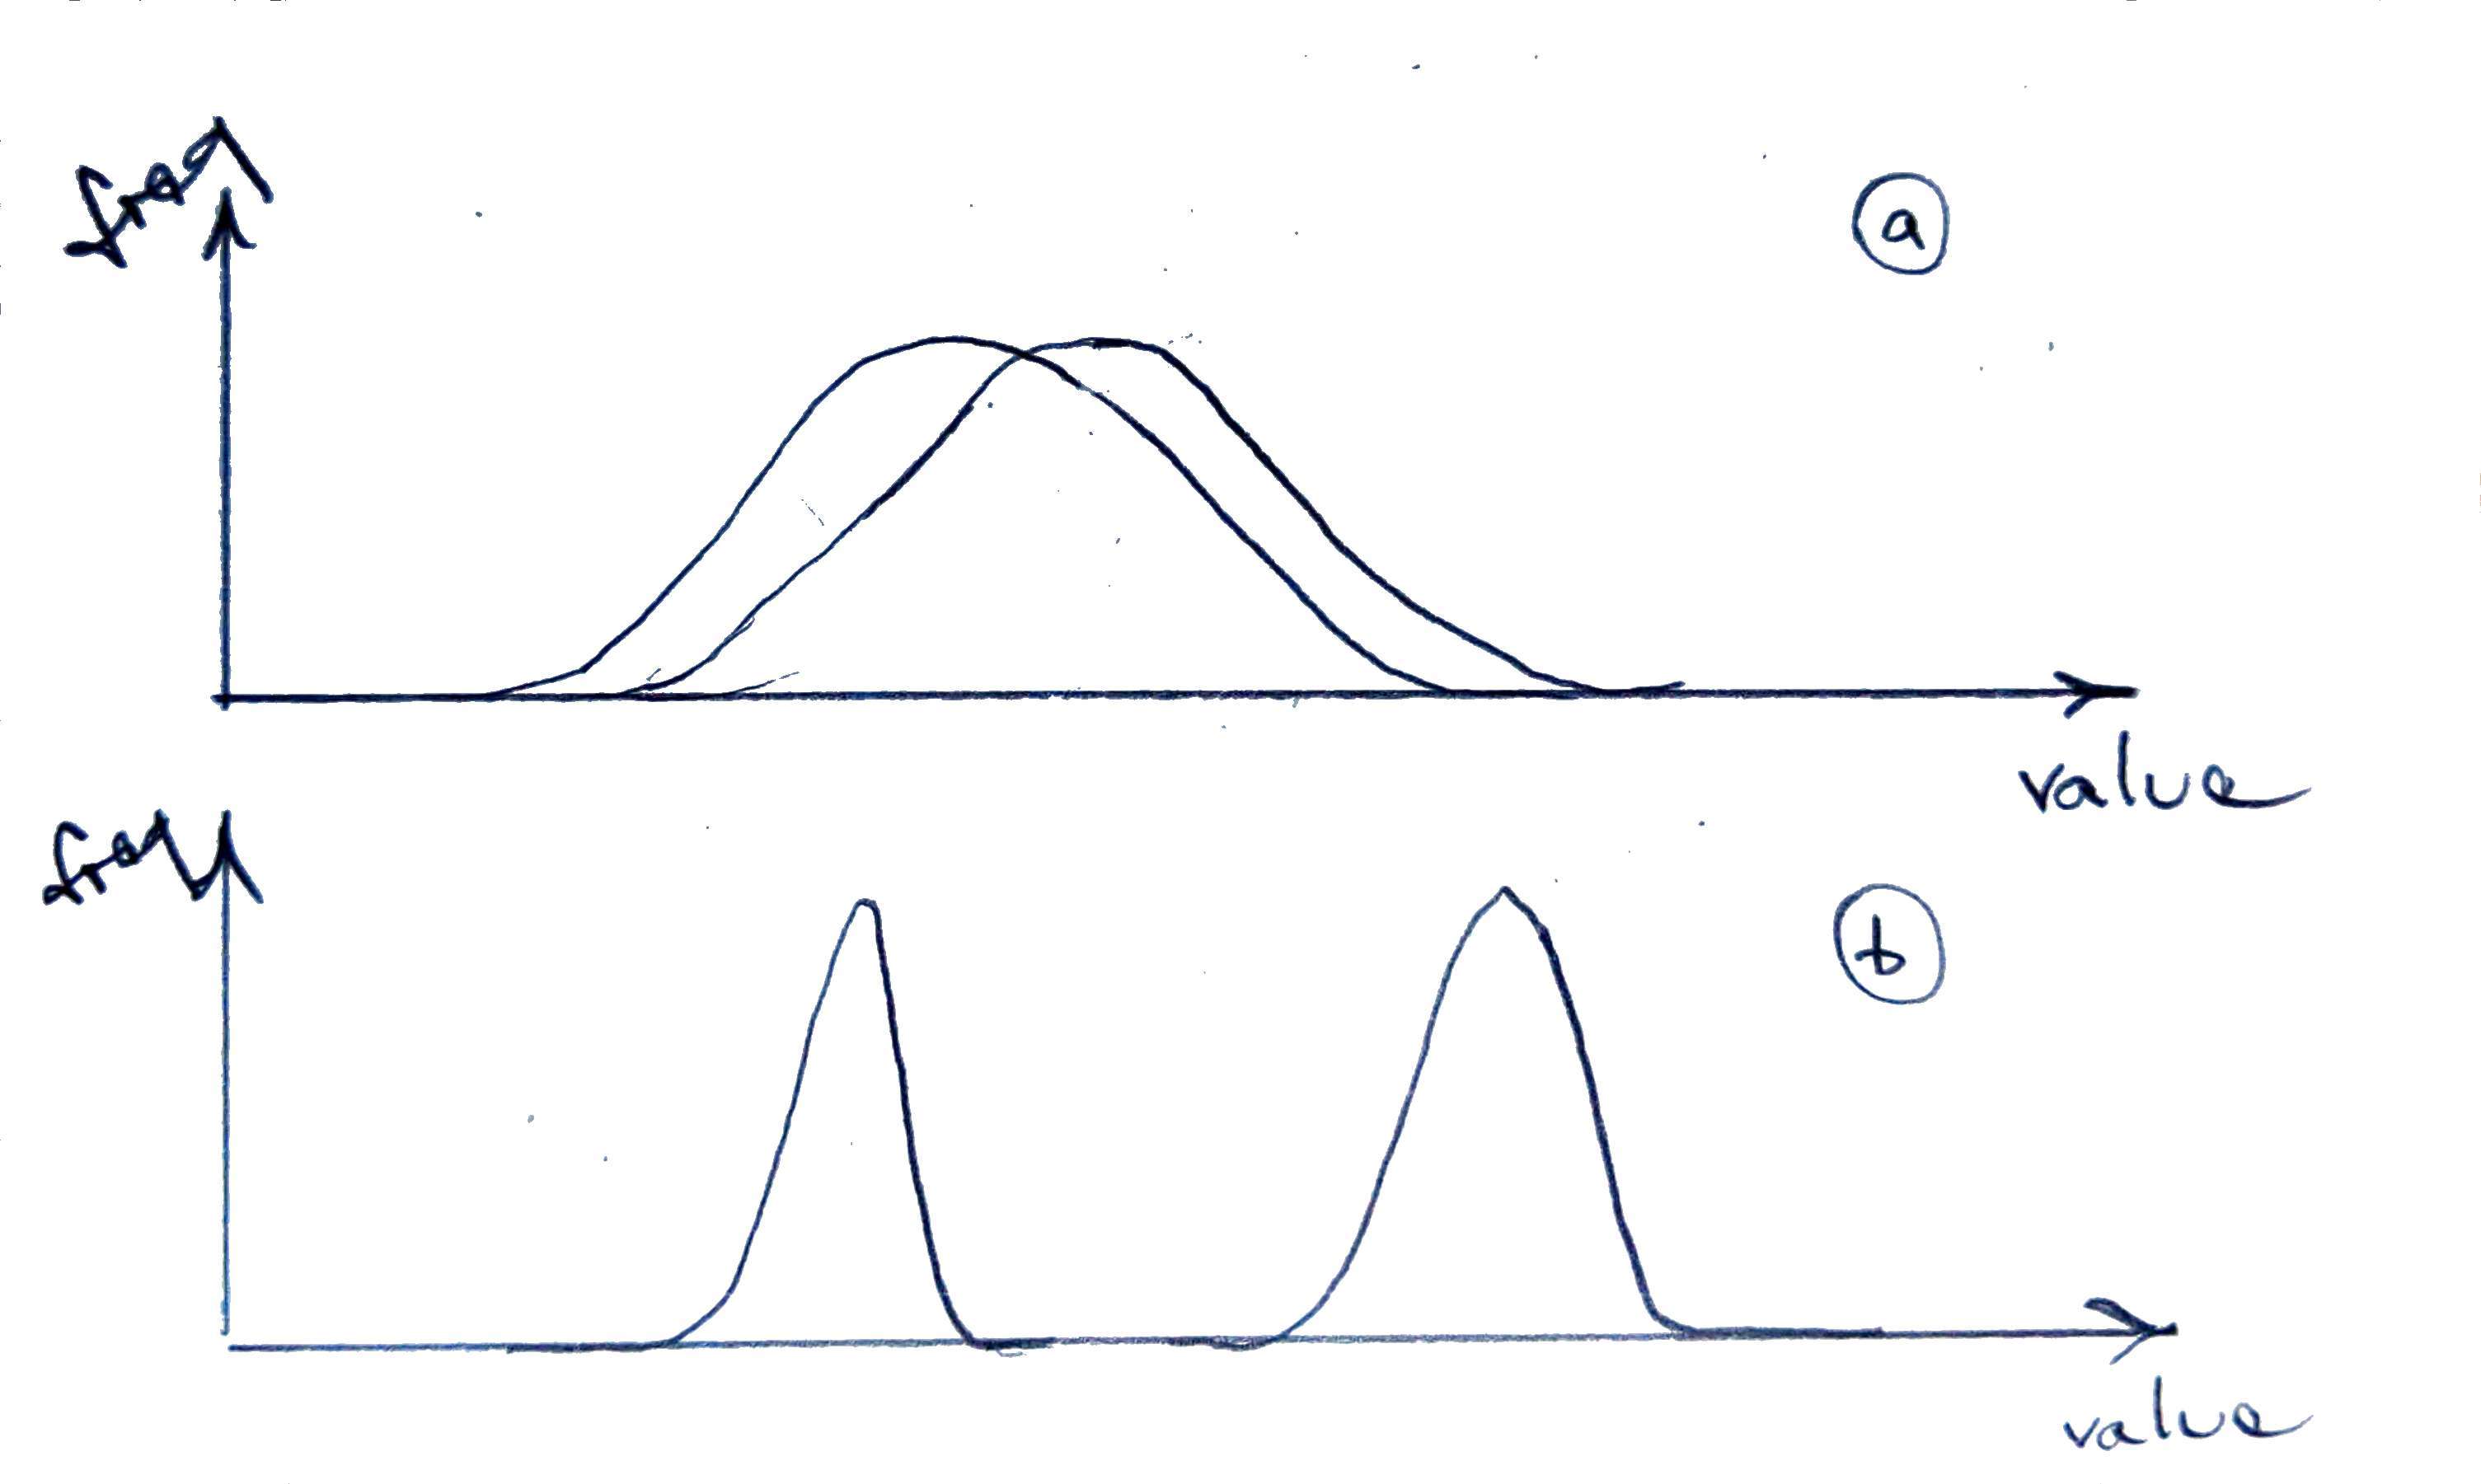
Shifted Distributions
Statistical techniques can tell us which of the differences in observations (represented as distributions) is more likely to have been from random fluctuations.
Two Types of Thinking
- Conceiving of treatment and control groups and measurements that allow you to test your idea, program, or hypothesis
- Choosing and executing statistical methods to establish the likelihood that your program caused the difference between the treatment and control groups
Concepts
Population
A complete group of measurements or individuals of interest.
Sample
A subset of a population used for a measurement or treatment. Sometimes called a sub-population.

Sampling
Measuring a few individuals from a population to get a sense of the whole.
Often it is prohibitively expensive or time-consuming to measure all of the members of a population. Sampling is a group of techniques that allow us to measure a smaller sample that reflects the overall population.
Distributions of Interest
What ensemble measurements are you interested in that relate to human-enviroment interactions or other topics of interest.
Factors
What factors do you think might explain observed differences in distributions?
Interventions
What treatments or interventions can we perform that have the potential to shift a variable in one of these distributions?