Populations and Samples
To look for fairness, we often split the members of a population into groups according to some categorical variable and look for differences between these two groups.
Categorical (nominal) variables include
- participation in a program
- race
- high income/low income
- different climate regions
To see if a variable makes a difference to an outcome, we often spread the data out by a continuous variable and look at how the outcome changes as we change that variable. We call this technique regression.
Concepts
Population
A complete group of measurements or individuals of interest.
Sample
A subset of a population used for a measurement or treatment. Sometimes called a sub-population.

Sampling
Measuring a few individuals from a population to get a sense of the whole.
Often it is prohibitively expensive or time-consuming to measure all of the members of a population. Sampling is a group of techniques that allow us to measure a smaller sample that reflects the overall population.
Statistical Inference
The use of a sample to determine the characteristics of the larger population.
Hypothesis Testing
The practice of determining whether an observed difference is due to random fluctuations or the experiment (drug, education, etc).
Statistical Significance
A measure of the probability that the mean of a random sample from a subpopulation was randomly drawn from the larger population.
For example, if you drew 10 random SSU students and they were all taller than 6 feet, this probably wasn’t random but was at basketball team practice.
Effect Size
This is the difference in the mean between an original distribution and the distribution after a treatment or from looking at a subpopulation.
Sample Mean
This is the mean of a sample of data we take from a larger population.
We are often concerned with how well this sample mean predicts the mean of the overall population.
Central Limit Theorem
- The distribution of means of large randomly-drawn subpopulations forms a gaussian distribution
- The width of this distribution of sample means is narrower for larger subpopulations
Inference
Assigns a probability of observing the null hypothesis or alternative hypothesis.
Null Hypothesis
Some examples
- Experimental drug outcome is not better than placebo
- Participation in a program does not increase outcomes
Standard Error
If you repeatedly take sample means, the standard error is the amount of spread these sample means have. This amount of spread goes down as you include more data in each of the repeated samples.
The standard error is related to the standard deviation of the population by the following equation, where
- SE is the standard error of the sample
- \sigma is the standard deviation of the population
- N is the size of the sample.
SE = \frac{\sigma}{\sqrt{N}}
Populations Example
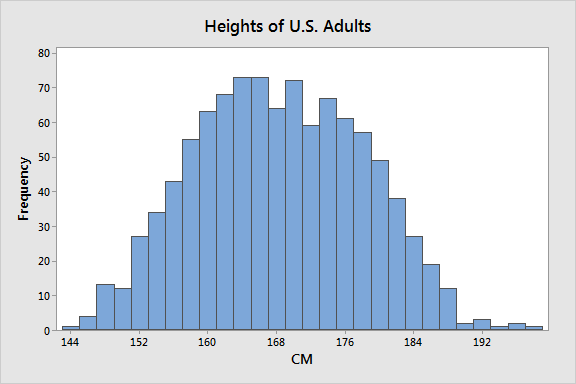
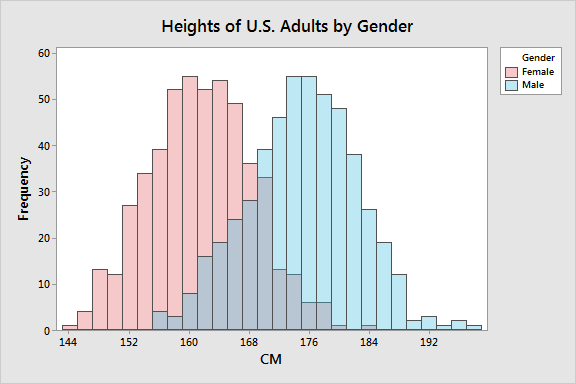
- If you have an adult human over 180cm tall, are they more likely to identify as male or female?
- If you have an adult human under 150cm tall, are they more likely to identify as male or female?
Spreadsheets
Common functions
- Mean or average
=average(range) - Gives the percentage of values below
valuein the range of data=percentrank(range, value) - Gives the value at which
percentileof the data is below that value=percentile(range, percentile) - Median
median(range) - Standard Deviation
stdev(range) - Range of data
A1:A10 - Range of data (entire column)
A:A - Range of data from another sheet
SheetName!A:A - ={data!A:A} gets an entire column from other sheet/tab from a command in one cell
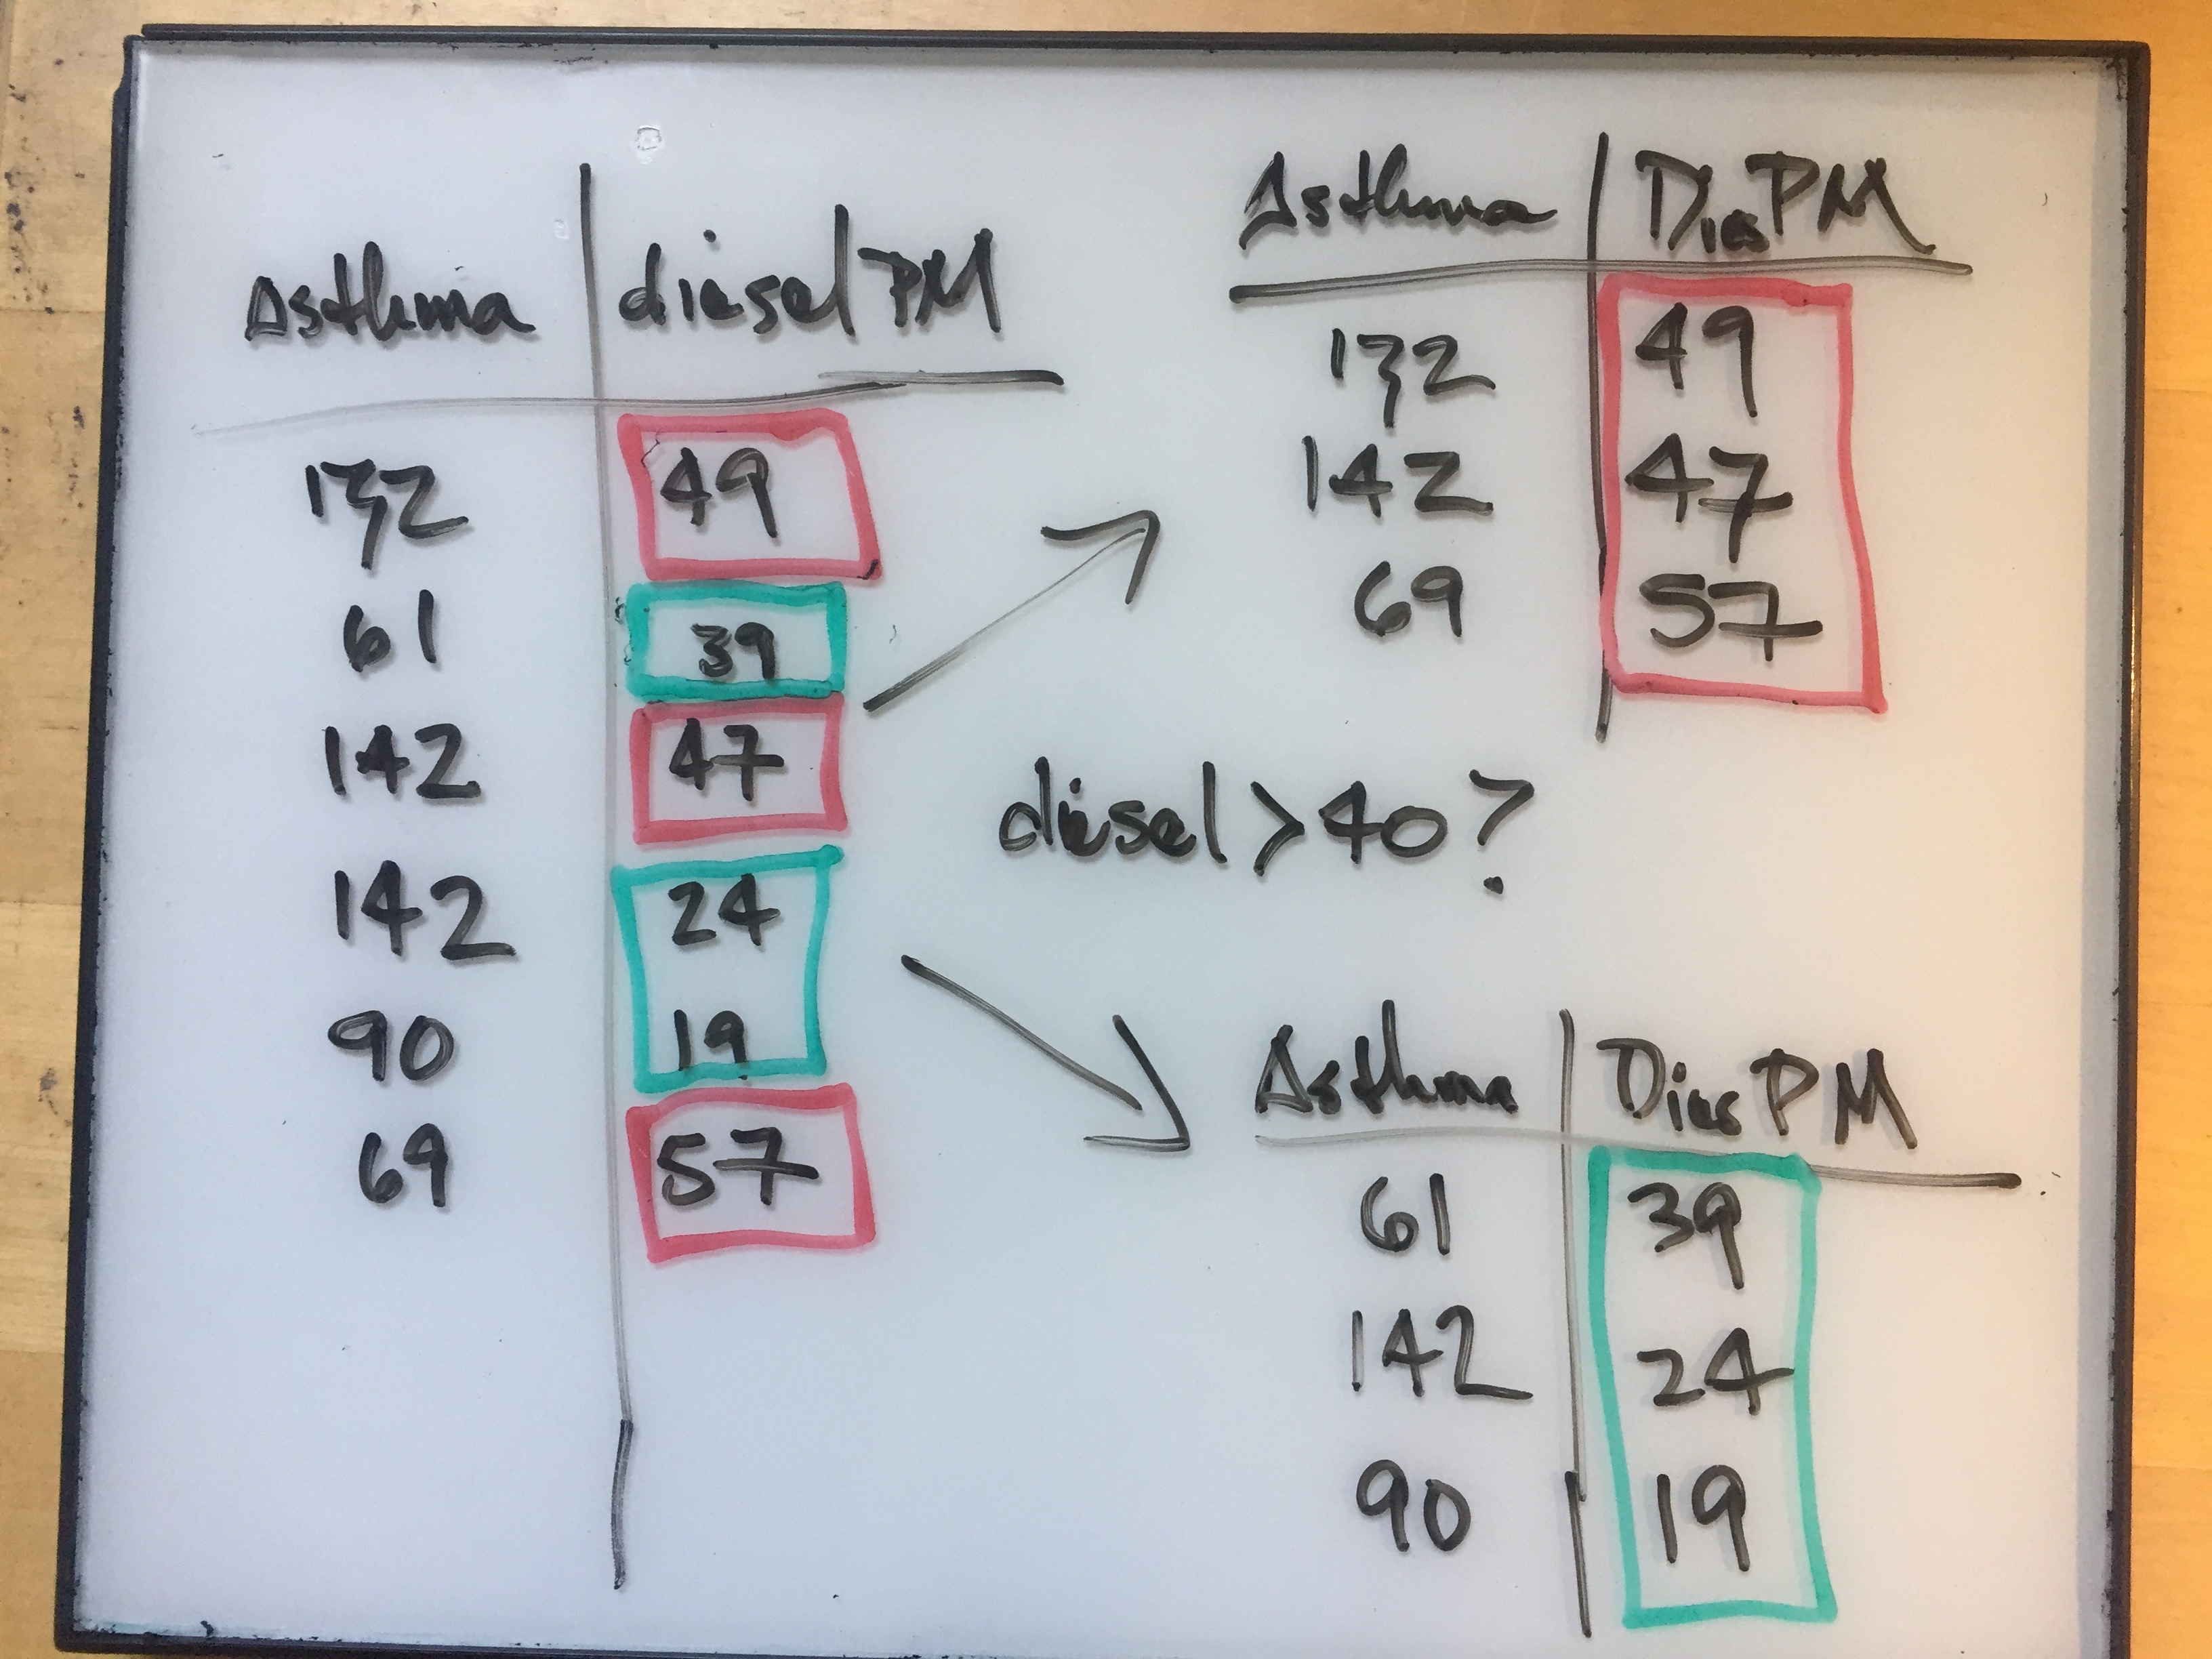
We can select a subpopulation from a column of spreadsheet data in Google Sheets using the query language.
=query(data!A:BT, "select A where B < 10")
=queryis the commanddata!tells the computer to look at the data sheet- if your sheet name has spaces in it, you’ll need to put the sheet name in single quotes (’’)
A:BTsays use columns A through BTselect Asays take values from column Awhere B < 10says to take those values from where column B is less than 10- use
"&D1$"in the query if you want to use cell value D1 in the condition in your query