Quantities of Interest
A key skill is identifying how a quantity of interest (energy use, efficiency) is related to your data set, often through slopes and areas.
If you can find this relationship, you can estimate or compute important quantities using slope and area calculations.
Time Series
A frequent form of data is a time series, where we take observations (samples) at regular intervals.
Slopes
If we have a time series of energy the slope of this is the power delivered.
Areas
If we have a time series of current, the area under the curve is the current delivered.
If we have a time series of voltage and current, the product of these two is the power.
If we have a time series of power, the area under the curve is the energy delivered.
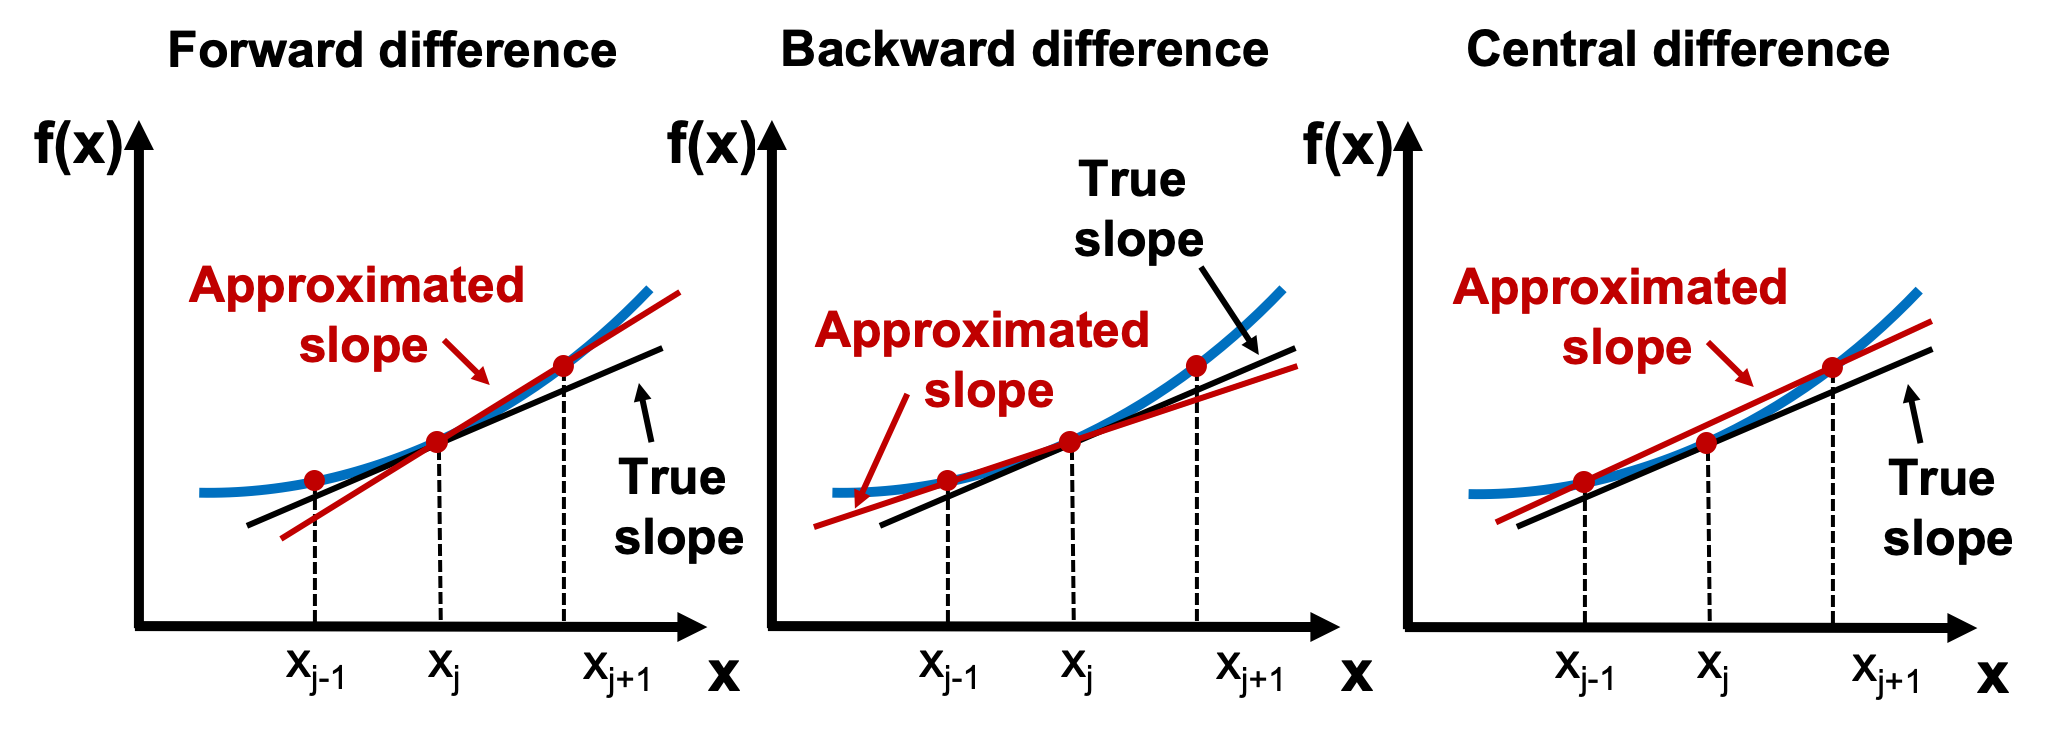
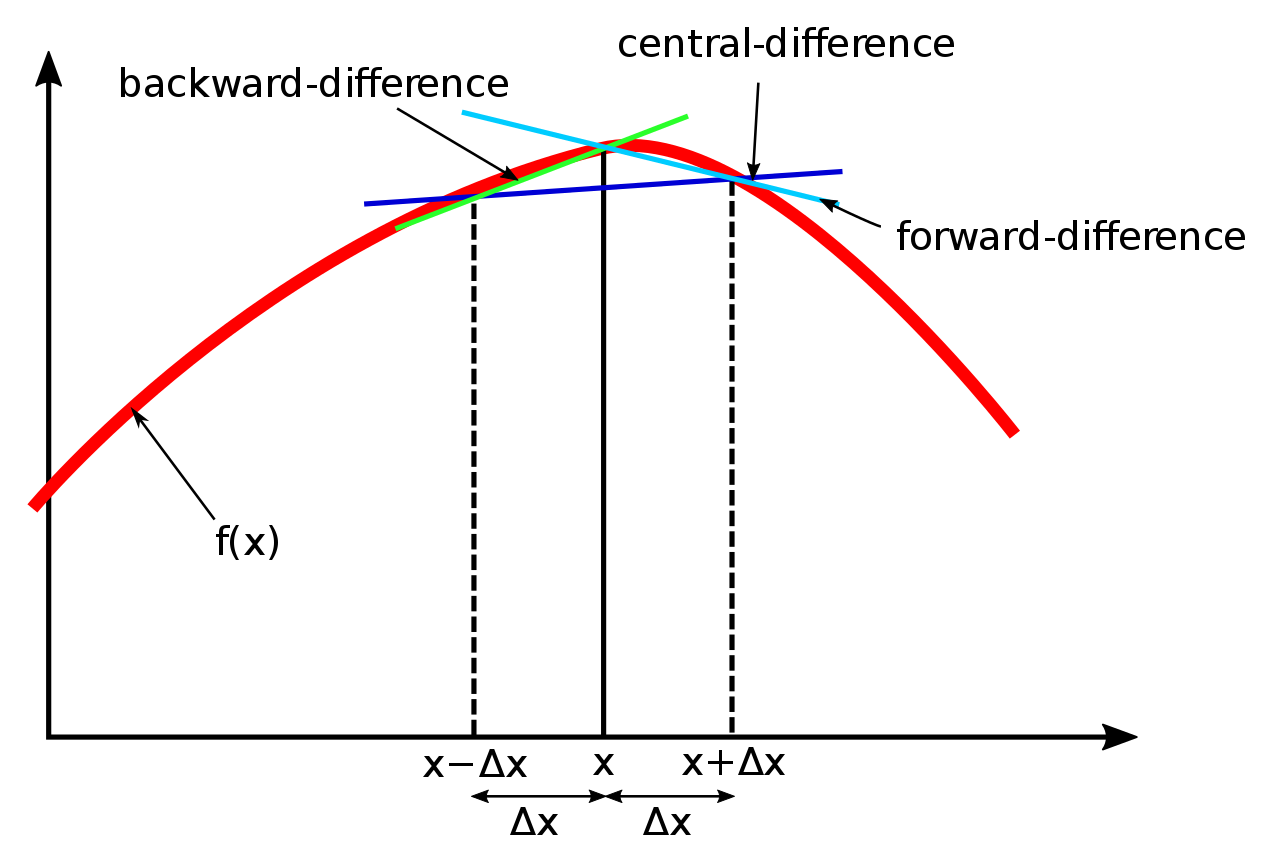
Calculating Slopes
Forward Difference
To calculate the slope at a point, we use that point and the point after it (forward in time).
Backward Difference
To estimate the slope at a point, we use that point and the point before it (backward in time).
Central Difference
To estimate the slope at a point, we don’t use the point itself, but the point before and after it in time.
Calculating Areas
Reimann Sum
This is the mathematical term for breaking up an area into areas. We will start with rectangles.
Left Reimann sum

Right Reimann sum

Trapeziodal Riemann sum

Computing Area
The area of a rectangle is the height times the width. The height we can get from each sample in our data set. To get the width, we find the difference between the samples on the x-axis.
This can sometimes involve cumbersome date and time arithmetic.