GEP 374b Tea Kettle Lab
Overview
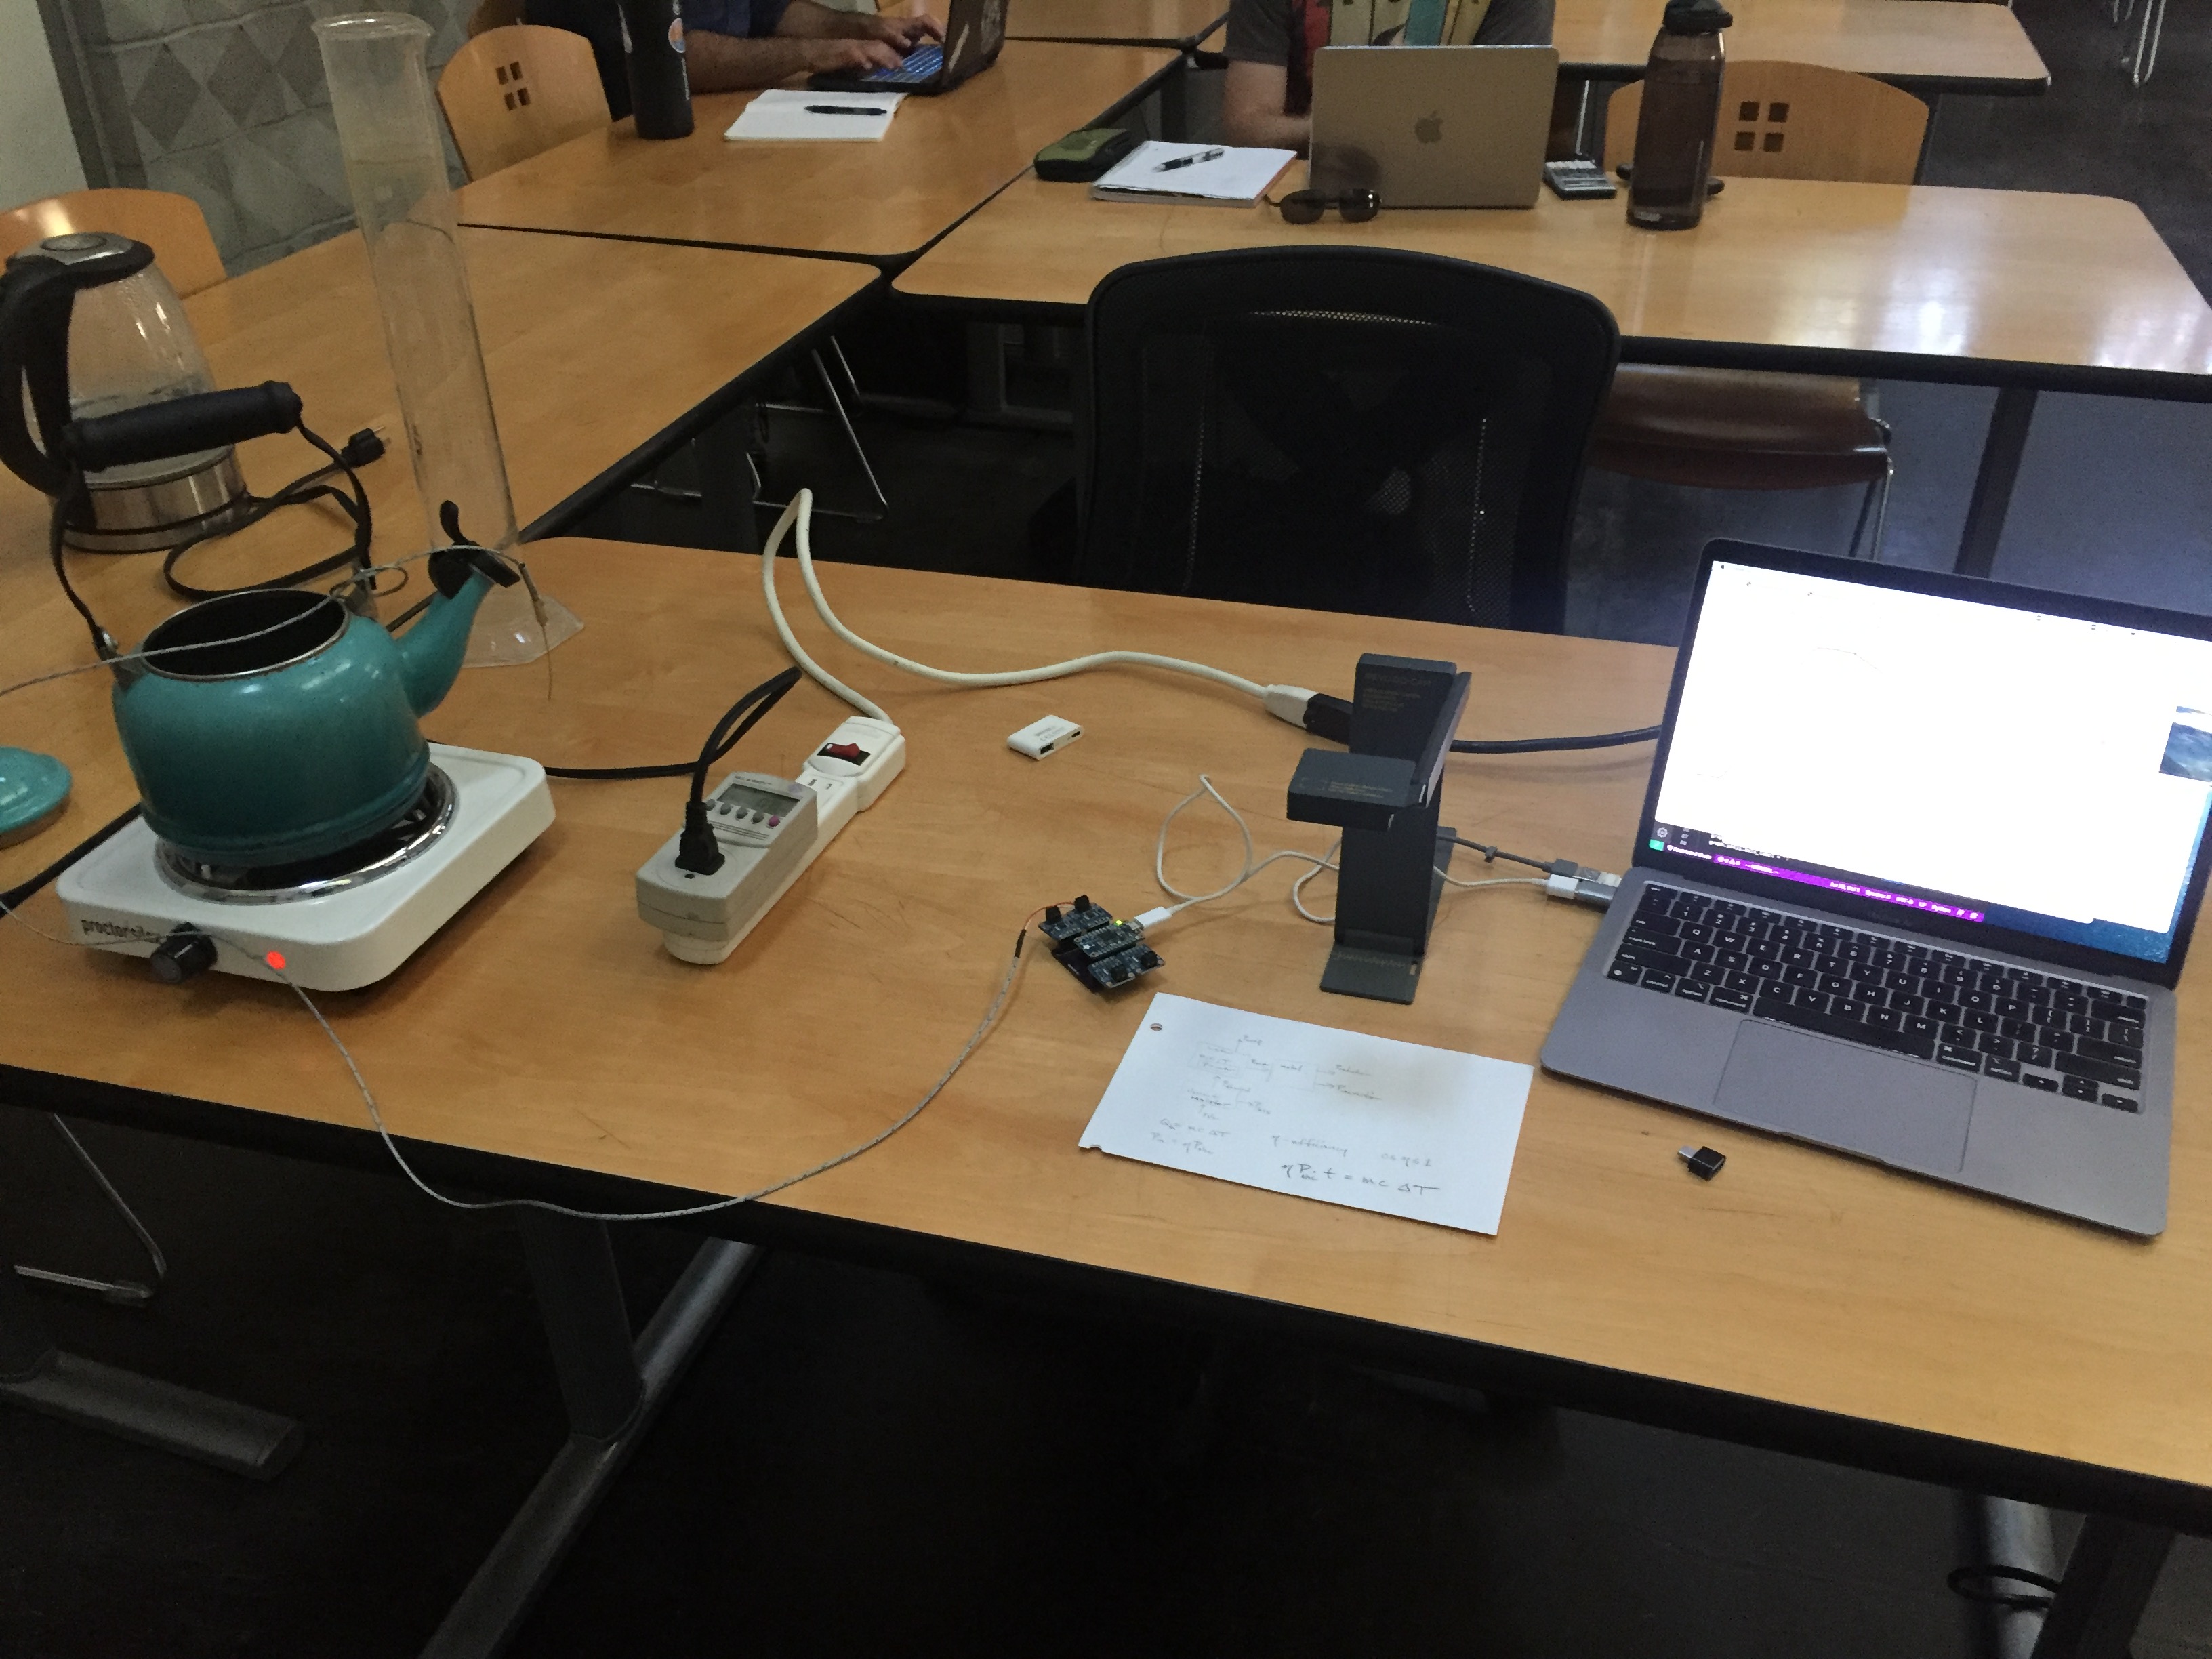
We will predict the time to bring an amount of water to a boil using an electric tea kettle. We will also estimate the heating efficiency of our devices.
Safety Concerns
- We will be connecting to the 120V power so be careful as you plug and unplug.
- We will have about 1 liter of hot water on the lab bench. There will be hot surfaces and the potential for spills.
- It is possible to overload a circuit if we place two hot plates. In the Stevenson 2412 Physical Geography Lab, the plugs are labeled with the panel number, a hyphen, and the circuit number. We will check that each hot plate is on a unique circuit.
Lab Planning Day
Our central question today is to predict the length of time until a pot of water boils?
Together, we will devise an apparatus and experimental plan.
Questions:
- What is a model using our relevant equations: E = P \cdot t Q = mc \Delta T that predicts time to boil (or reach any temperature)?
- What quantities do we need to measure?
- Which of these are direct measurements?
- Which of these are indirect measurements?
- What instruments will we use?
- How will we collect data to confirm our prediction?
- What calculations will we make?
Data Collection Day
Today, we will carry out our experimental plan.
Data Analysis Day
During this class period we will polish our calculations for presentation.
- Decide on what elements would give a reader confidence in our prediction
- Prepare these elements in a report
Exercises
1 Predictions
- Sketch a diagram of our apparatus.
- Calculate a prediction for the time to boil for 1 kg of water at a power of 1000 watts. Our sink water is 20C and assume a 90% efficient conversion of electrical energy to internal energy of the water.
- What value of the temperature time-series slope do you predict in celsius per minute?
- (Your analysis will go more quickly if you place this in a spreadsheet.)
2 Observations
- Publish your table of collected data.
- Do you data roughly agree with your predictions?
3 Reflection
- Turn in a PDF with
- graph of observed temperature data
- comparisons between boiling time prediction and observation
- estimate of efficiency
- you can cut and paste parts of the spreadsheet into your document
- any comments on what surprised you or what you learned
Photo