Motor Lab
Overview
We are going to confirm that the voltage constant of a motor is consistent with a previously measured value. This constant relates the voltage applied to the speed of the motor.
We will also be estimating the internal resistance of the motor.
Safety Concerns
- We will be connecting to 120V power.
- We’ll be using the 18V power supplies with test leads so watch for short circuits.
- The disks and fans will be spinning at high rpm and could break the skin.
Materials
- Small DC motor
- Motor disk with white stripe
- Motor fan with white blade
- 18V power supply
- Motor mounts
- Test leads
- Laptop with arduino application
- Arduino with LED output
Background
Two important linear relationships:
Voltage speed relationship
E = k_v \omega
The back-emf voltage, E, generated by the motor is equal to the angular velocity, \omega, of the motor multiplied by the voltage constant, k_v, of the motor.
We will measure the voltage constant in units of RPM/volt and use the label K_v.
When the current through the motor is very low (no or low torque/load on the motor) we can approximate the back-emf as the voltage on the terminals of the motor.
Torque current relationship
T = k_t I
The torque, T, generated by the motor is equal to the current, I, through the motor multiplied by the torque constant, k_t.
Torque
Torque is the rotational equivalent of force and has dimensions of force times distance. It is commonly expressed in newton-meters. Note that a newton-meter is the same as a joule.
To find the torque, we multiply the perpendicular force twisting something about the axle by the distance from the axle.
Constants
The voltage constant and torque constant are equal.
Angular Velocity
Angular velocity has dimensions of angle per time and measures how fast something is spinning. Two common units for angular velocity are revolutions per minute (RPM) and radians per second.
Measuring Angular Velocity
In this lab, we will use a strobe to measure angular velocity. A strobe works by flashing a light at a steady frequency at a spinning object with a bright mark on its surface. When that rotation period is a multiple of the strobe period, the bright mark will appear stationary. When the strobe frequency is a multiple of the rotation frequency, the multiple stationary bright marks will appear.
We adjust the strobe period until we are certain we are at the period as the rotation.
Period and Frequency
Period (T) has dimensions of time and is the time between two successive periodic events.
Frequency (f) has dimensions of one over time and is the reciprocal of the period.
T = 1/f
Motor Lab Predictions
Central question: Is a laboratory observation of the motor voltage constant consistent with the reported value of 1000 rpm/volt.
We have motors with a voltage constant of approximately 1000 rpm/volt. We will make a prediction of the motor speed and motor current as you increase the voltage with a spinning disk and a spinning fan.
The key distinction between the disk and the fan, is that the disk will require much less current than the fan to spin the motor at the same RPM.
Predictions
- What do you predict for the relationship between the speed and
voltage for the motor with a disk?
- Draw a graph of the RPM–voltage relationship
- Draw a graph of the RPM–current relationship
- How do you expect the speed and voltage curve to differ for the fan?
- Reason based on the motor model
- Draw a graph of the RPM–voltage relationship
- Draw a graph of the RPM–current relationship
Motor Lab Observations
- Place disk on motor
- Use strobe to determine RPM–voltage relationship of motor
- Also record current
- Place fan on motor
- Use strobe to determine RPM–voltage relationship of motor
- Also record current
The bare motor will only have the torque from the friction of the motor itself. The disk will add negligible torque to the motor but allow us to measure the RPM. The fan will add significant torque and therefore current since it is pushing air.
Motor Data Collection Day
Today, we will carry out our experimental plan. We are attempting to confirm the previously measured RPM/volt for the motor.
Measurements
- Record the unloaded voltage–speed relationship for 0 – 5 krpm in increments of 1 krpm
- Record the fan-loaded voltage–speed relationship at the same rpm readings
Motors Data Analysis Day
During this class period we will polish our calculations for presentation.
Using our observed RPM and voltage relationship, we can find the Kv of the motor from the slope. Place your data in the spreadsheet of your choice and use a linear fit to find the slope.
If you have time, use the difference between the two curves to find the internal resistance of the motor.
Exercises
Motor Notes Review
Review the notes above and these linked notes and answer the following questions:
- How are torque and current related in a motor?
- How is the generated voltage and the rotating speed of a motor related?
Download Arduino Application
- Download the Arduino application to your computer
- Test your board using the “Blink” Application
- Did you have any problems or did it run successfully? List any details that might be useful for future students.
Circuit Diagram
- Draw out a diagram of the power supply and the motor internal resistance and back EMF
- Describe how the back EMF varies with motor speed and with motor current
- Describe how the voltage across the internal resistance varies with motor speed and with motor current
Disk Predictions
- What do you predict for the relationship between the speed and
voltage for the motor with a disk?
- Draw a graph of the RPM–voltage relationship
- Draw a graph of the RPM–current relationship
Fan Predictions
- How do you expect the speed and voltage curve to differ for the fan?
- Reason based on the motor model
- Draw a graph of the RPM–voltage relationship
- Draw a graph of the RPM–current relationship
Data Collection
- Upload a photo of your notes with
- A table of collected data
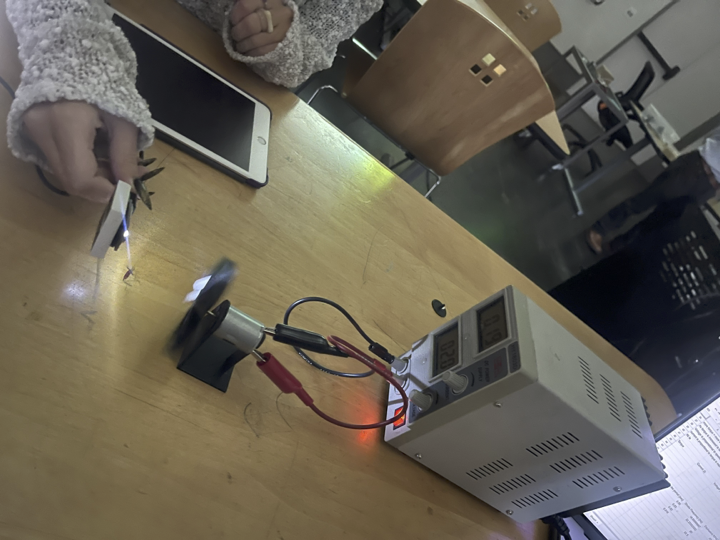
- Upload a photo of your apparatus in use
Data Analysis Report
- Turn in a PDF document created from a word processor (MS Word,
GDocs, etc.) with
- Table of data
- Graph and fit of motor constant
- Stretch: graph and fit of internal resistance
- Short discussion of your predictions and observations
Appendix
Strobe Code
Cut and paste this code into your Arduino application for upload to your LED strobe. Be sure and check that your board and port are correct.
- For the “MiniMetro” on the breadboard use “Arduino Uno”.
- For the larger mega board use “Arduino Mega or Mega 2560”.
// Simple Strobe Sketch

// set the strobe period here in milliseconds
int period_ms = 100;

void setup() {
  // initialize digital pin LED_BUILTIN as an output.
  pinMode(LED_BUILTIN, OUTPUT);
}

void loop() {
  // turn LED on for 1 millisecond
  digitalWrite(LED_BUILTIN, HIGH);
  delay(1);

  // turn LED off so the whole cycle is period_ms long
  digitalWrite(LED_BUILTIN, LOW);
  delay(period_ms - 1);
}
Strobe Operation
- Plug in usb cable between strobe and computer
- Start up Arduino/strobe application
- Copy and paste code into the Arduino application
- Select a time period between flashes corresponding to the RPM you expect
- Enter the period into the strobe application
- Reupload the code each time you change the period
- Adjust the voltage until the rotation and strobe are synchronized
- Check that you are at the correct frequency by dividing time period
by two
- You should now see two images of the “stripe”
Photo