1 HDD and CDD Reading
Please read the linked notes on heating and cooling degree days and answer the following questions.
- How are heating degree days related to q = UA \Delta T?
- Why do you think HDD or CDD will be more important for energy use in the coming years?
2 Estimate degree days from temperature plot
Description:
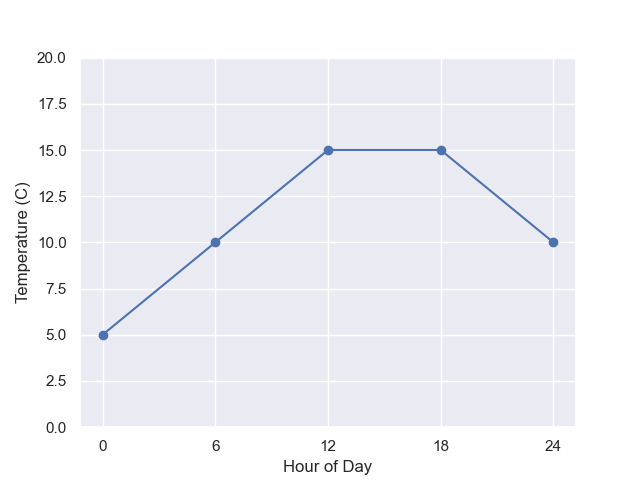
We will estimate the quantity of degree-days from a plot of temperature data. This graph shows the outside temperature over a period of 24 hours. Assume a thermostat temperature of 15 degrees celsius.
Instructions:
- Shade the area representing the heating degree days. This is the time that a heater would be running.
- Explain your choice of area.
- Estimate the number of heating degree days in units of Celsius-days from your area in the data shown below.
3 Estimate energy use from temperature plot
Description:
Simple estimate of energy use given degree-days from plot A home with a UA value of 150 W/K sees the outside temperature in the plot above. Assume a thermostat setting of 15C.
Instructions:
- Describe your method to estimate the energy use of the home.
- Compute your estimate of the energy use in units of joules.
4 Spreadsheet Logic Video
Please watch the linked video on using logic in spreadsheets and answer the following classes.
- Can you provide an example of where an “if” would be useful for an energy calculation?
- Can you provide an example of where an “and” would be useful for an energy calculation?
5 Estimate Degree Days using spreadsheet
Spreadsheet estimate of degree days using meteorological data (TMY or NOAA)
Description:
Find the heating and cooling degree days for a site over the course of a year.
In this exercise, we will:
- Identify and download data set
- Compute hourly temperature differences for the year by subtracting outside temperature from desired indoor temperature
- Sum only positive numbers for heating degree days using spreadsheet logic
- Convert sum to degree-day units
Instructions:
- Find a source for meteorological data. This could be a TMY (Typical meteorological year) file or historical data from NOAA.
- Download a year of data from the file to your local computer.
- Open the file in a spreadsheet.
- Identify the column with the outside temperature.
- Decide on the internal temperature.
- Determine the time between data points in the data set. (Usually one hour.)
- Discuss how to structure the data to perform a sum over the year.
- Discuss the units of the temperature differences, are they temperature or temperature-time? How do you ensure they are temperature-time?
- Discuss how to use the if-then statement.
- Discuss how to structure the subtraction and if-then to get heating or cooling values.
- Implement the subtraction in a separate column
- Implement the if-then result in a separate column
- Perform the sum.
- Convert the units of the sum to degree days.
- Comment on the readability of your spreadsheet.
- Does your answer agree with the totals published online?
6 Manually estimate degree-day slope over time
Description:
In this exercise, you will determine the rate at which degree days are changing in an area or community you are interested in.
Instructions:
- Navigate to the Cal-Adapt site, choose degree-days, and a region
- Interpret the graph axes
- What are the dimensions and units of the slope?
- What is the sign of the CDD slope and the HDD slope?
- Discuss the implications of these slopes for energy use of buildings in the area.
- Visualize an average or fit line through the data.
- Estimate the slope from now until 2050 by estimating the rise and run in the data.
- Estimate the change in energy use for a building in the area you chose for heating and cooling.
7 Use Spreadsheet to find slope of degree-day projections
Description:
You will use a spreadsheet to compute the line that best fits the degree day projection data provided by Cal-Adapt.
Instructions:
- Navigate to the Cal-Adapt site, choose degree-days, and a region
- Interpret the graph axes
- What are the units of the slope?
- What is the sign of the CDD slope and the HDD slope?
- Download the Cal-Adapt degree-day projections onto your computer.
- Load the data into a spreadsheet
- Discuss structure of data in spreadsheet (different models)
- Create spreadsheet plot of data
- Discuss which forecasts models you will use (or you could make a slope for each model)
- Review the columns and choose the a column to calculate the slope for
- Read documentation for
slope(y_values, x_values)andintercept(y_values, x_values)functions - Discuss the units of the slope
- Compare your computed slope to your estimate in the previous activity
- Create a column for the linear prediction y = mx + b where m is from slope function and b is from the intercept function
- Verify on a plot that the linear prediction follows the data
- Discuss the implications of the values of these slopes
8 Energy use projections
Estimate of energy use increases from Cal-Adapt data
Description:
You will use the degree-day projections from Cal-Adapt to determine the energy use increases for an area or community you are interested in.
Instructions:
- Choose an area and determine the rates of change of the HDD and CDD over time
- Describe the heating and cooling technologies in a real or hypothetical building in your chosen area
- Will the energy for heating increase or decrease?
- Will the energy for cooling increase or decrease?
- Will natural gas increase or decrease? Why?
- Will electricity use increase or decrease? Why?
- Estimate the rate of change in natural gas use each year
- Estimate the rate of change in electricity use each year