Electricity Distribution Grid
- Three phase alternating power
High Voltage Distribution
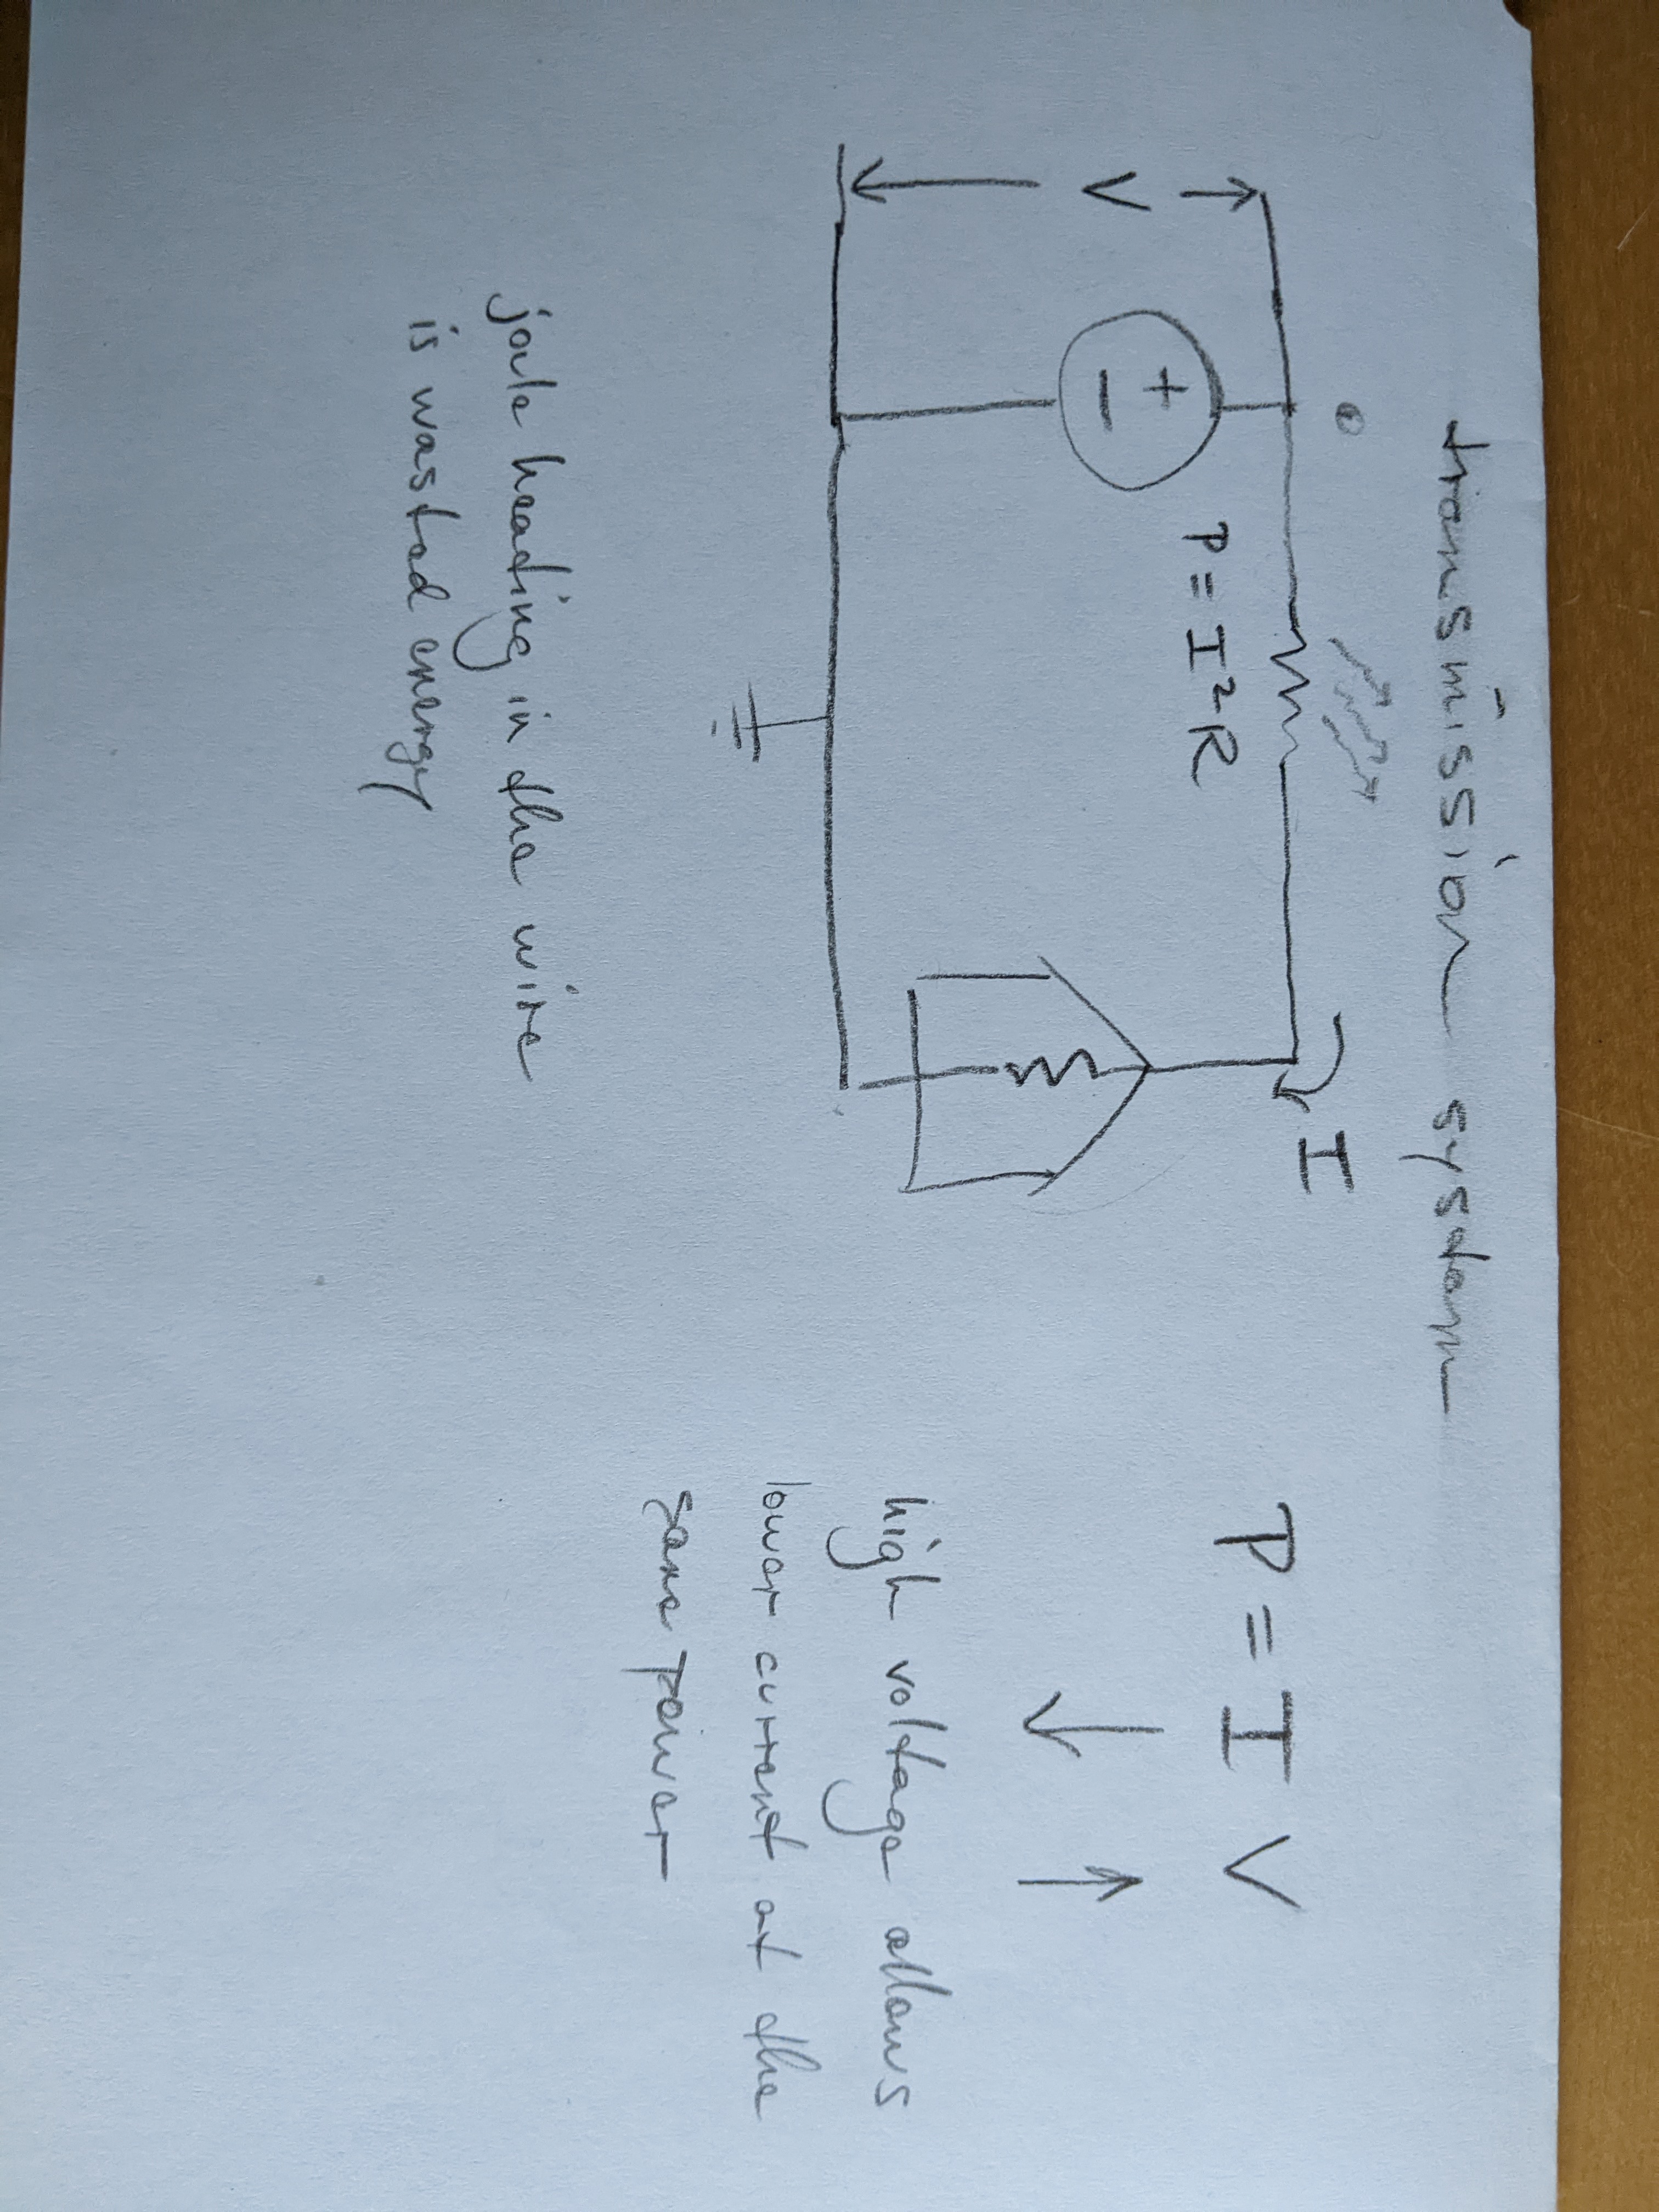
- Power is equal to the product of the current and voltage
- By raising the voltage, we can use less current for the same power
- Heating losses in the wire are proportional to the square of the current
Supply and Demand
Must be very well balanced on grid failures occur.
Grid Frequency
Changes in the frequency of the grid indicate imbalances of supply and demand.
In the US, the grid operates at 60Hz. Frequency deviations as small as 0.3 Hz can trigger blackouts to avoid damage to the grid.
Load Following
Grid control strategy that views the electrical demand or load as fixed and adjusts the supply to meet demand.
Supply Following
Grid control strategy that recognizes that renewable energy sources fluctuate and schedules demands and loads that could be deferred to times when energy is available.
- Cars often charged at night, charging during the day would use solar peak
Demand Response
Strategies to adjust the demand (rather than supply) to respond to grid imbalances in supply and demand.
Diurnal Load Variation
The observed daily fluctuations in power demanded from the grid due to human activity.

Duck Curve
A sharp increase in demand occurs in the early evening as folks return to their homes. At the same time, the amount of solar electricity available is sharply decreasing. This creates a need to bring lots of power online quickly which is very challenging for grid operators.
Storage
One tool for balancing the grid is stored electricity.
Grid Enhancing Technologies (GET)
There are several technologies that could be used to improve the existing grid to allow more capacity and the integration of renewables.
Idaho National Lab has a page on these technologies.
Clean Firm Electricity
Electricity that is low carbon (clean) and that is not dependent on weather or daylight. Geothermal is an example.
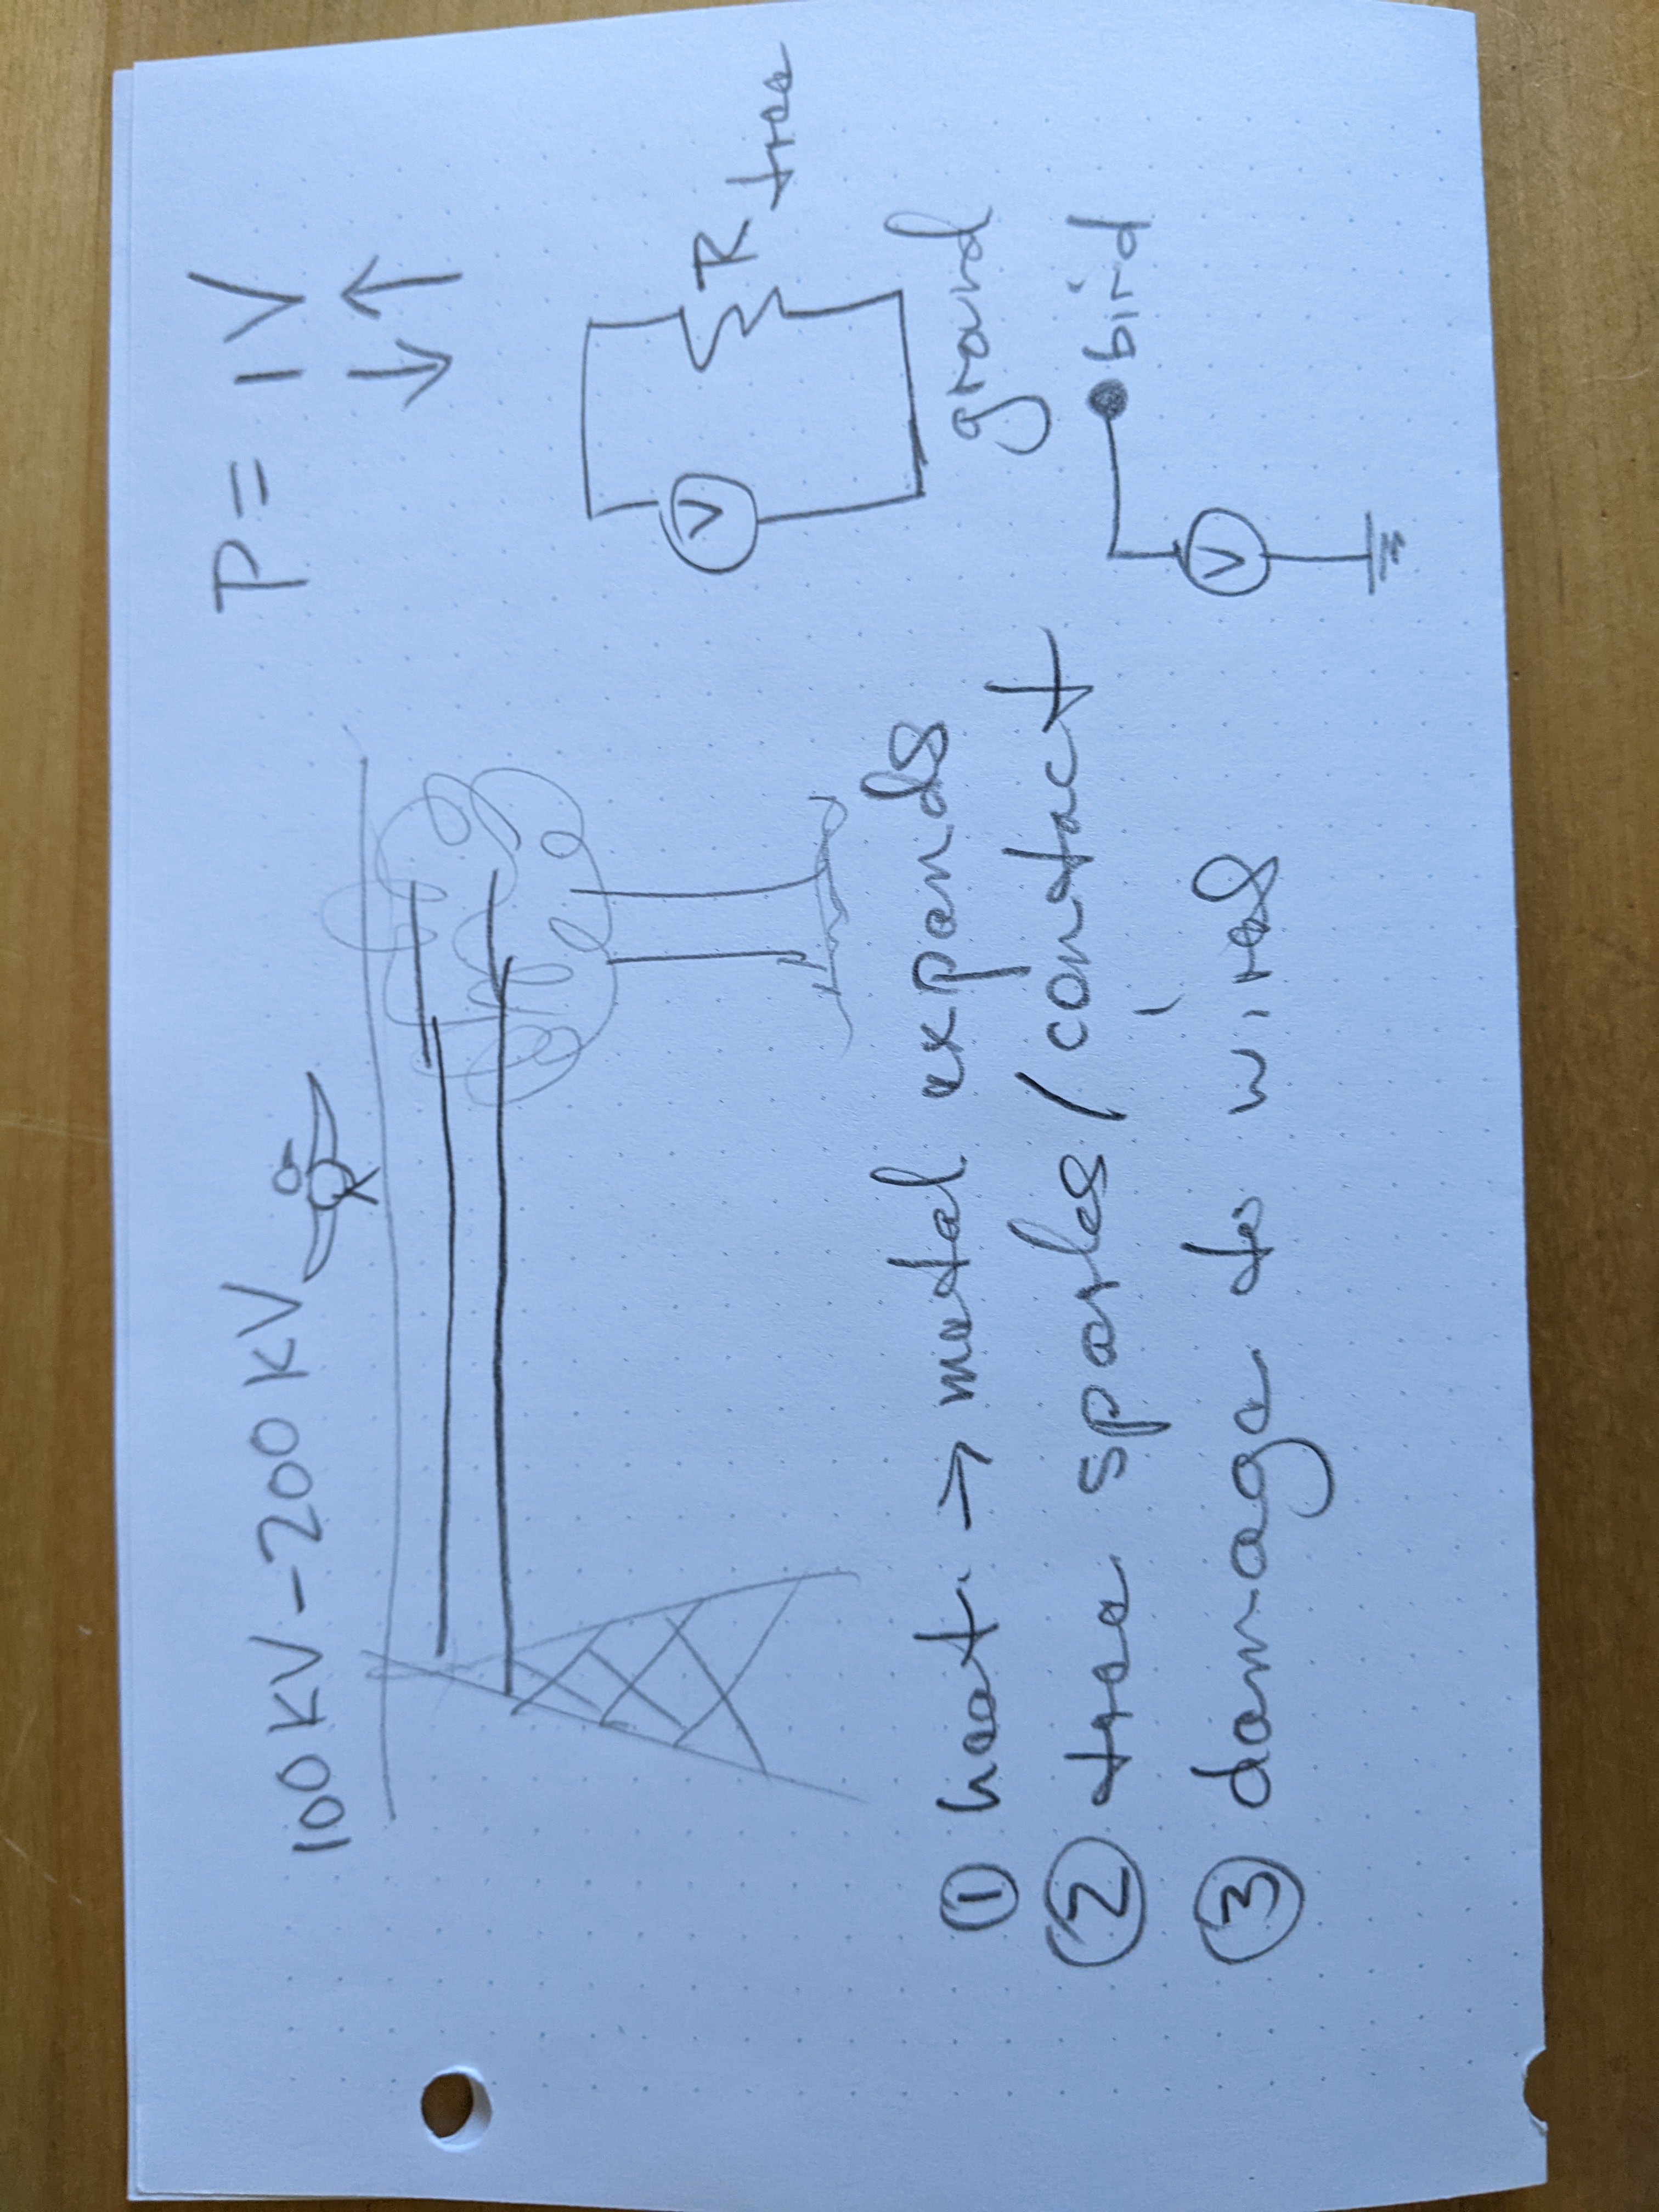
Fire Risk
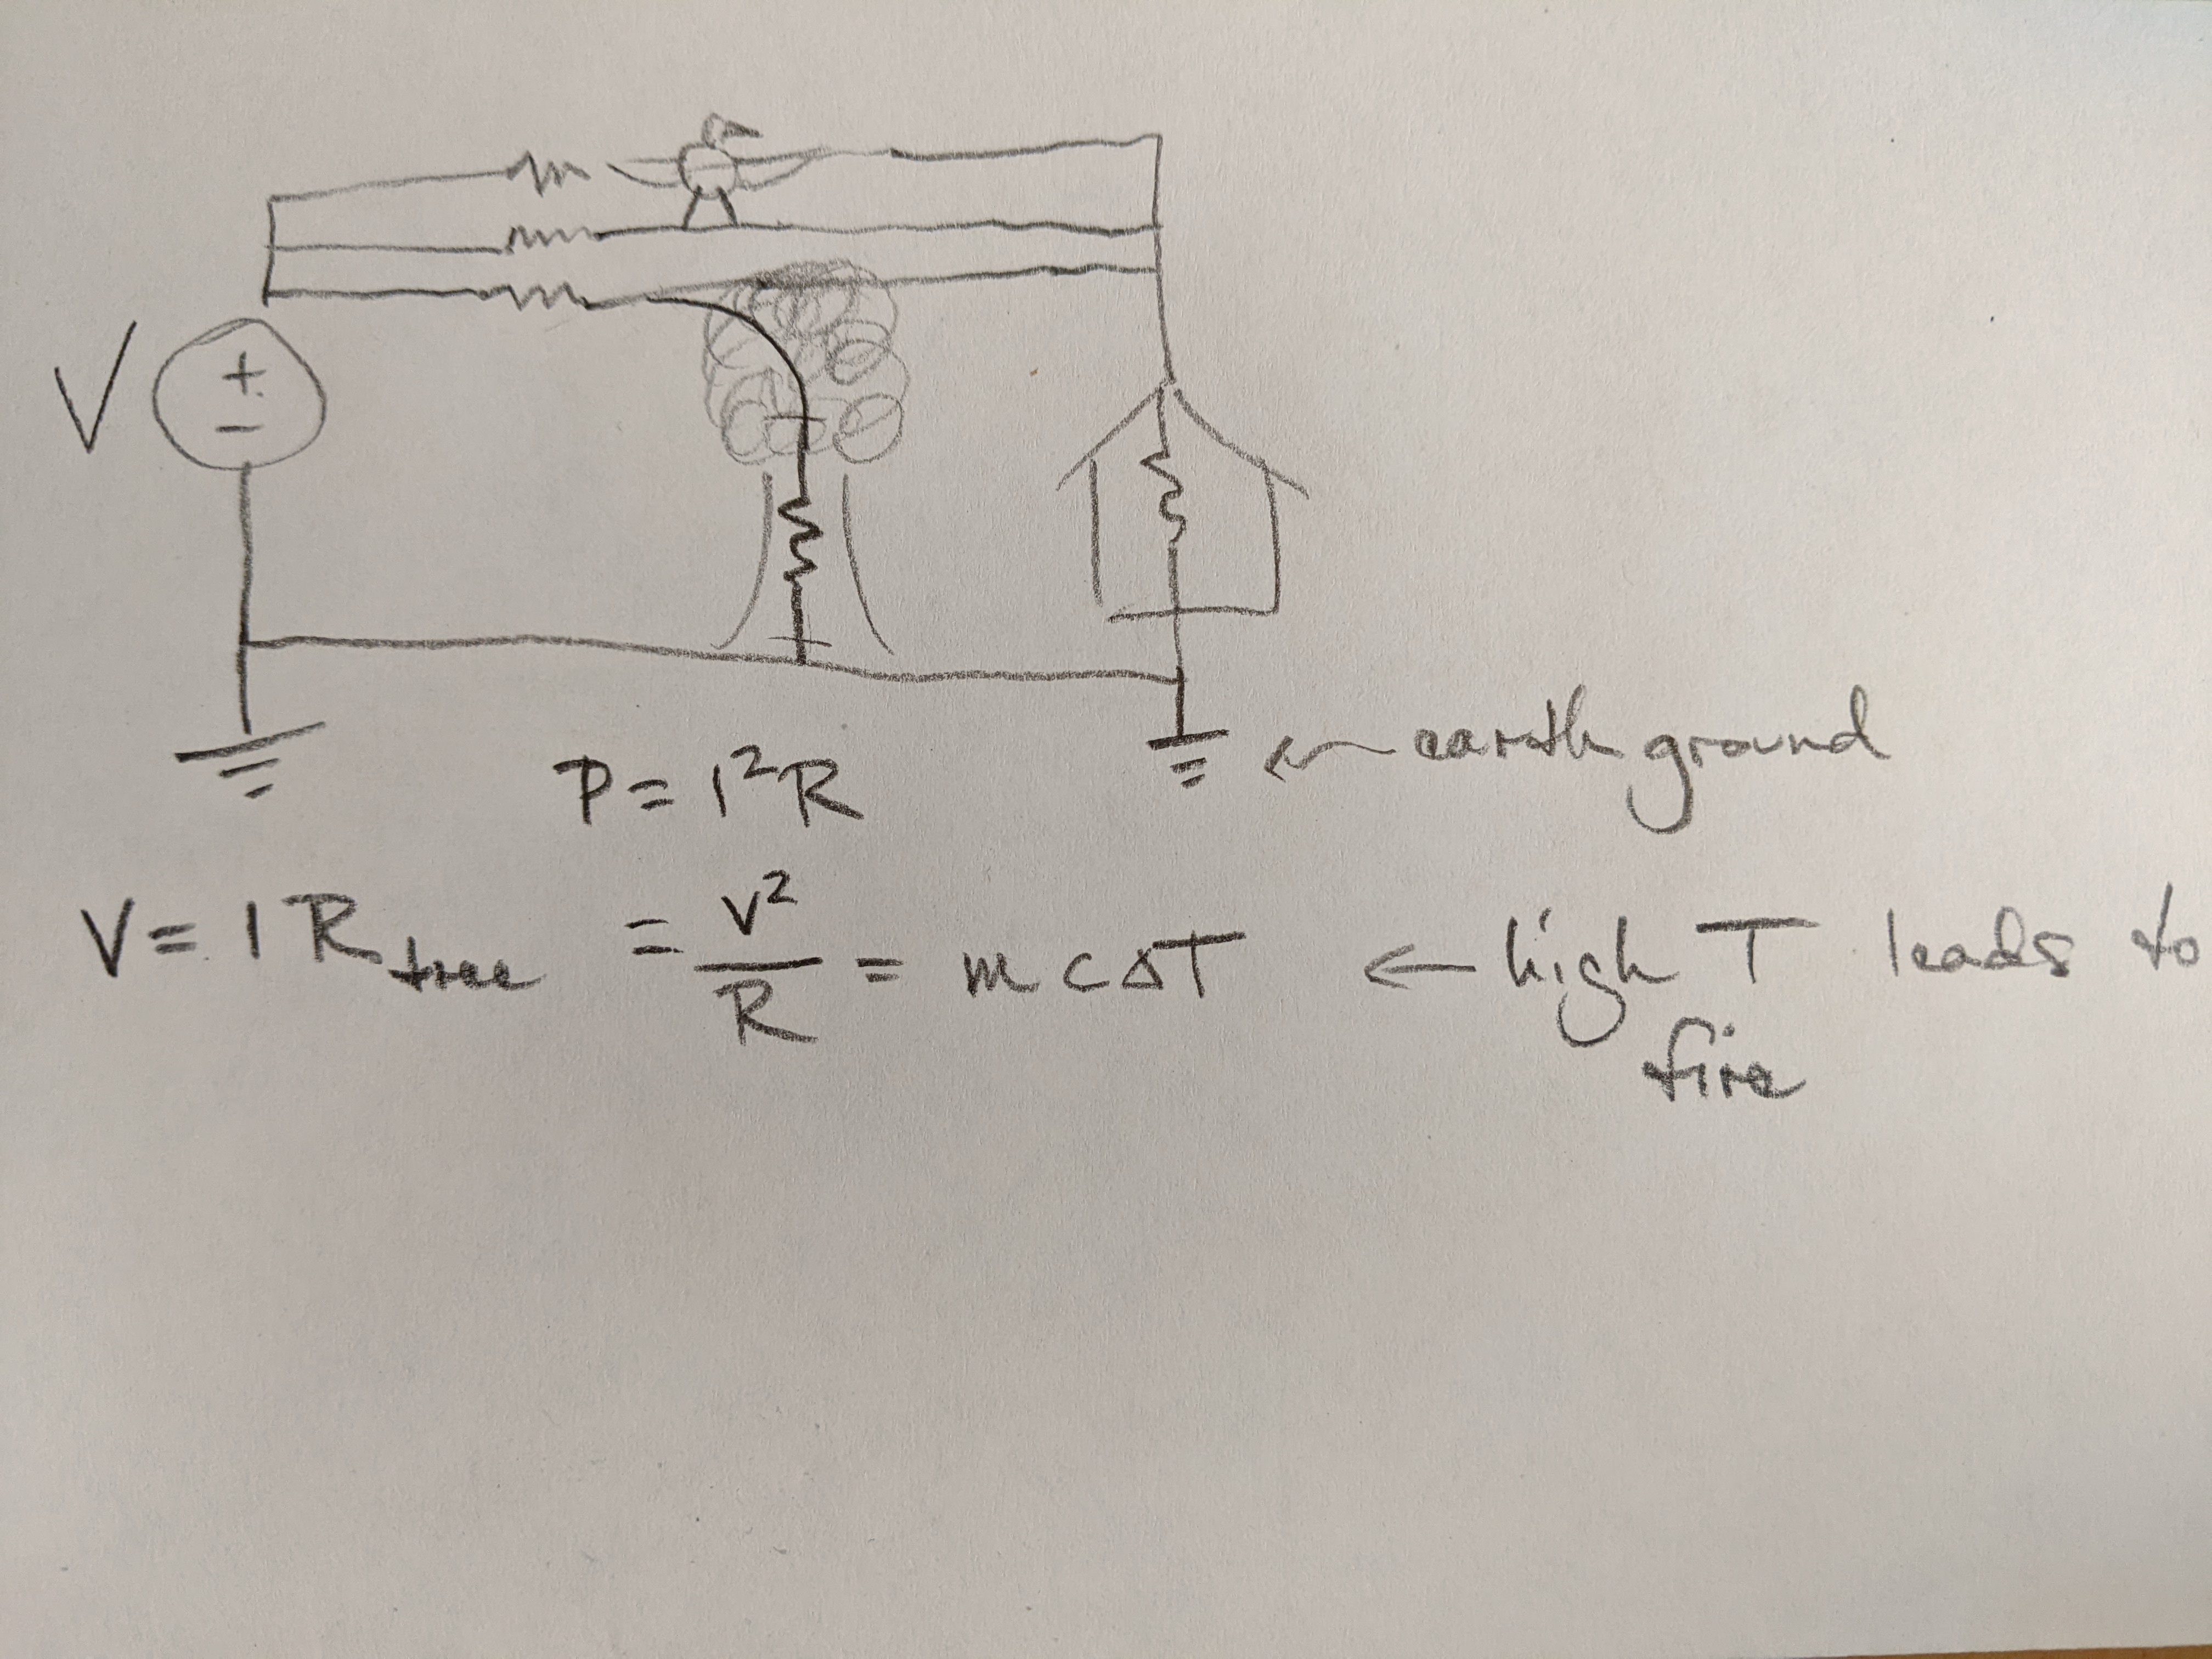
- The earth is a ground in our grid, so trees can complete a circuit
- If a tree completes the circuit, current flows through the tree
- The electrical potential energy is converted to thermal energy
- Thermal energy can lead to temperatures high enough for ignition
Grid Upgrades
- Undergrounding lines costs between $2 million and $6 million per mile